Boston Condo Market Update — September 2026
Back Bay, Beacon Hill, South End, Seaport and more
By Catherine Bassick, Bassick Advisors at Douglas Elliman Real Estate. Published September 29, 2026.
BOSTON CONDO MARKET · SEPTEMBER 2026 · DATA THROUGH SEPTEMBER 27
Boston condo dollar volume is up 10.5% on flat sales. Here is where the money is moving, neighborhood by neighborhood, and what it means for buyers, sellers and fiduciaries. This report covers condominiums only.
| MEDIAN PRICE $1,060,000 ▲ 10.4% vs. 2025 |
AVERAGE PRICE $1,538,558 ▲ 10.5% vs. 2025 |
CLOSED SALES 1,825 ● Flat vs. 2025 |
DOLLAR VOLUME $2.81B ▲ 10.5% vs. 2025 |
The short version
- The median condo price is $1,060,000, up 10.4%, on exactly the same 1,825 closings as last year.
- The downtown core is leading: Mid/Downtown closings are up 42%, the Seaport 23%, Beacon Hill 22%. The South End is down 14% and South Boston 10%.
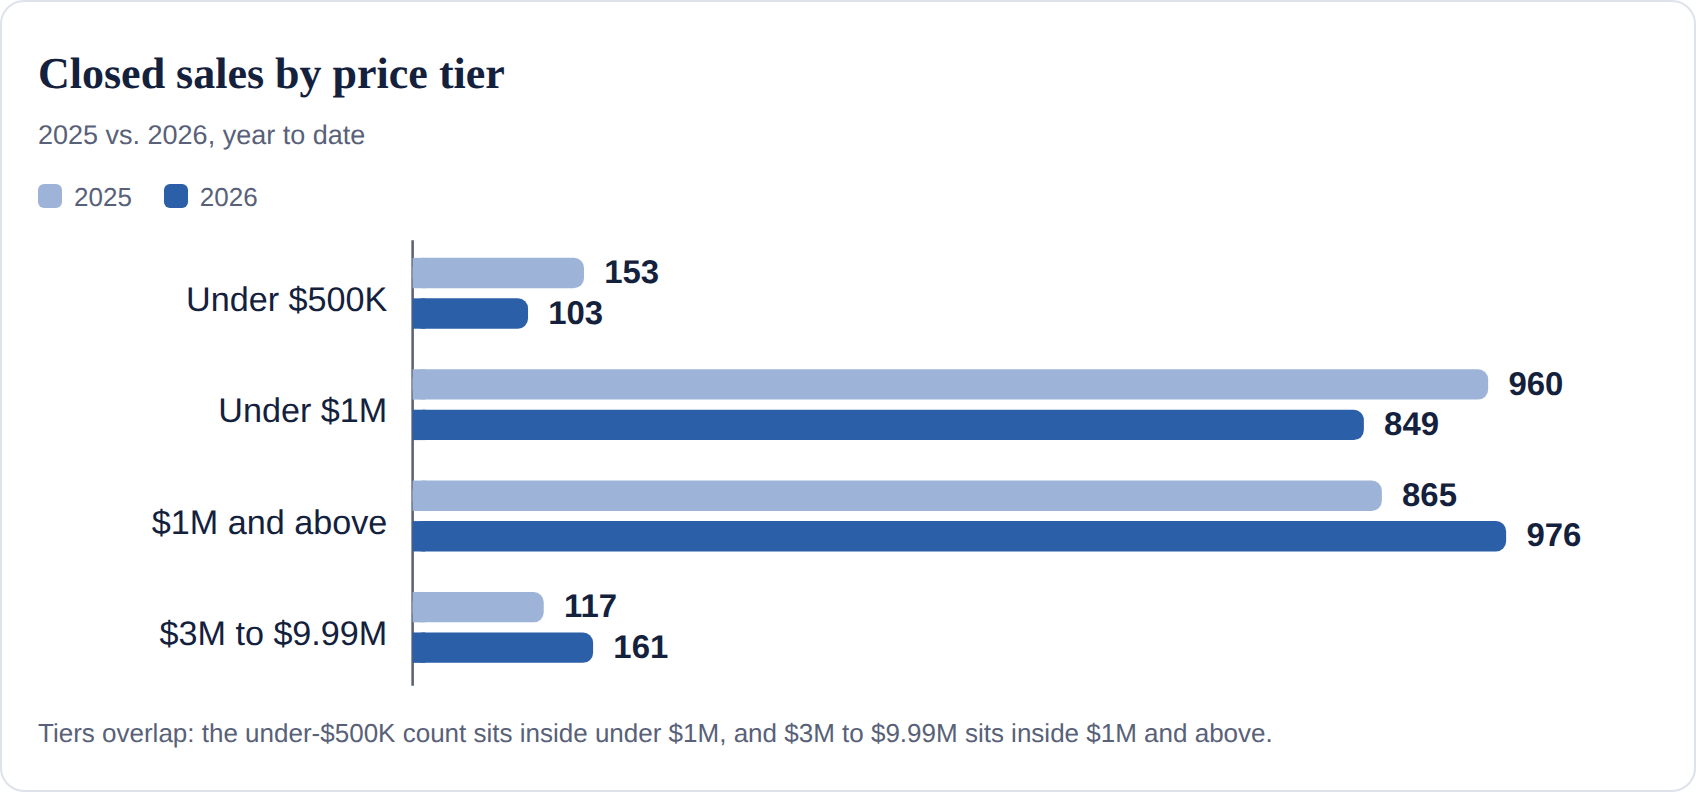
- 53.5% of closings are $1 million or more, the first time that share has topped half. Sales under $1 million fell from 960 to 849.
- 99 closings at $2,000+ per square foot, up from 75. One Dalton averages $2,921 per square foot.
- Supply is about 3.1 months, so sellers who price to recent closings still hold the advantage.
Market at a glance
Boston condo dollar volume is up 10.5% on flat sales, so the market is trading up rather than trading more.
Through September 27, 1,825 Boston condos have closed, exactly matching this point last year. The average price is $1,538,558 and the median is $1,060,000, up 10.5% and 10.4% from 2025. Both are the highest of any year in the 2019 to 2026 reports, and the median has now crossed $1 million.
The gains are concentrated in the downtown core and the upper price tiers. Back Bay, Beacon Hill, Mid/Downtown and the Seaport are all up in closings, while the South End, South Boston and the North End are down.
Boston condos by the numbers
The deal count is flat but the dollars are not: the same 1,825 closings produced about $267 million more in sales than a year ago.
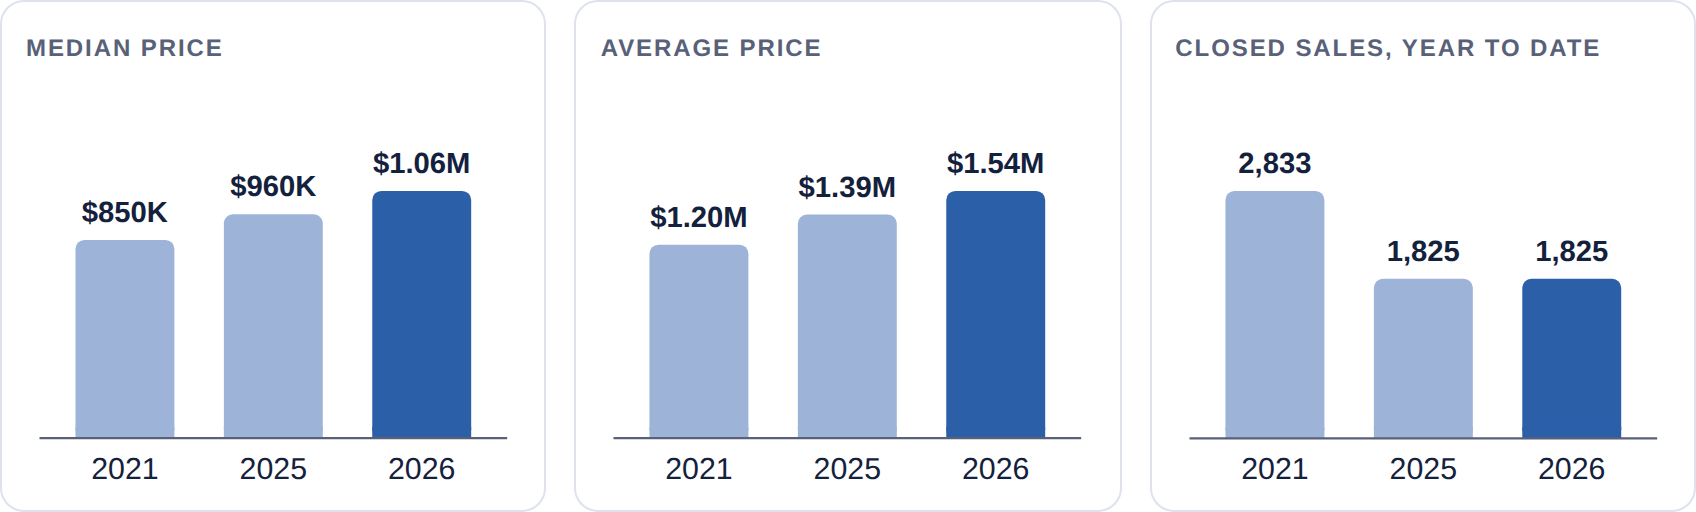
The longer view puts the year in context. Sales are about 36% below the 2021 pace of 2,833, yet the median is up 24.7% from $850,000 and the average is up 27.7% from $1,204,955. Dollar volume is 17.7% below 2021, which shows how much of the market has shifted to higher price points rather than more transactions.
WHAT IT MEANS
Prices are holding and rising even though transaction counts have not recovered. That combination usually signals limited supply. Buyers are paying more for fewer available homes, and sellers who price accurately are being rewarded. The report shows five-year appreciation of 4.9% for the median and 5.5% for the average, against 3.4% over ten years, so recent growth has outpaced the long-run rate.
Where the money is going: Boston condo neighborhoods
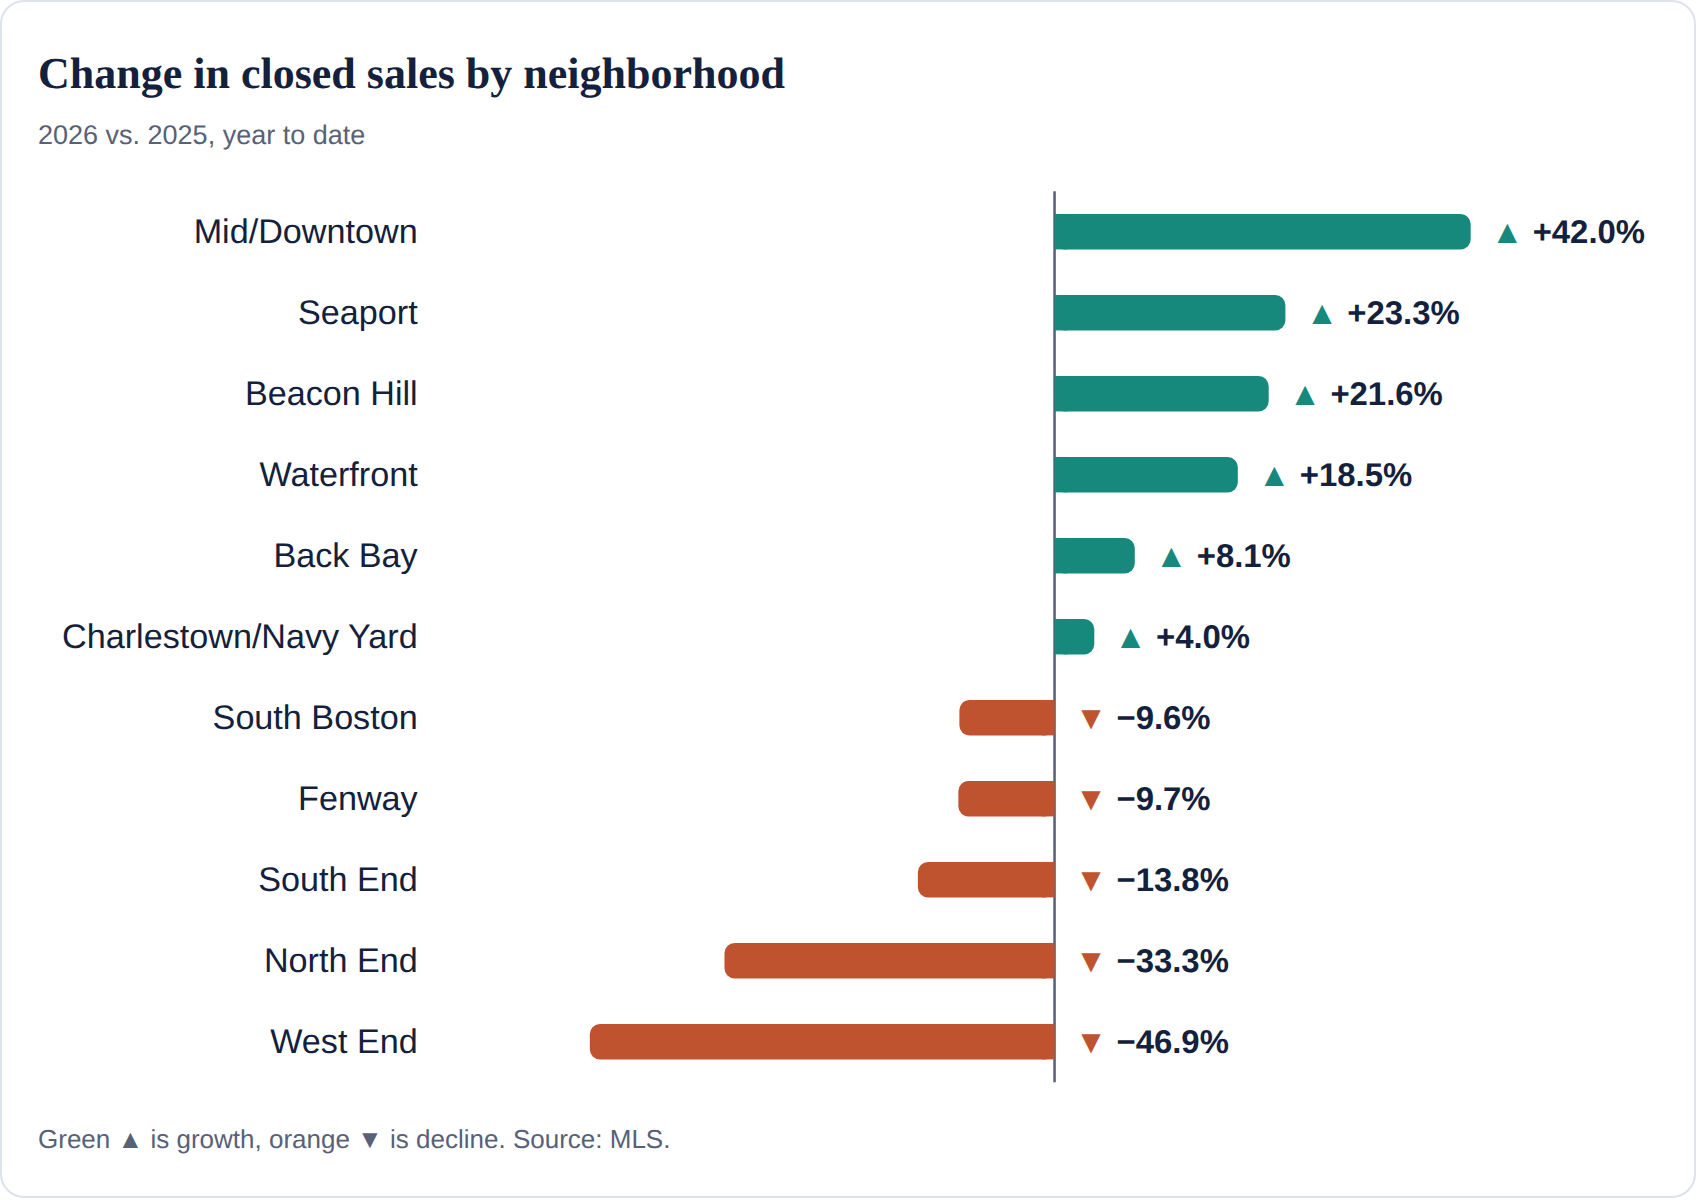
Activity is moving toward the downtown core and away from the outer neighborhoods: Mid/Downtown closings are up 42%, while the South End and South Boston are down 14% and 10%.
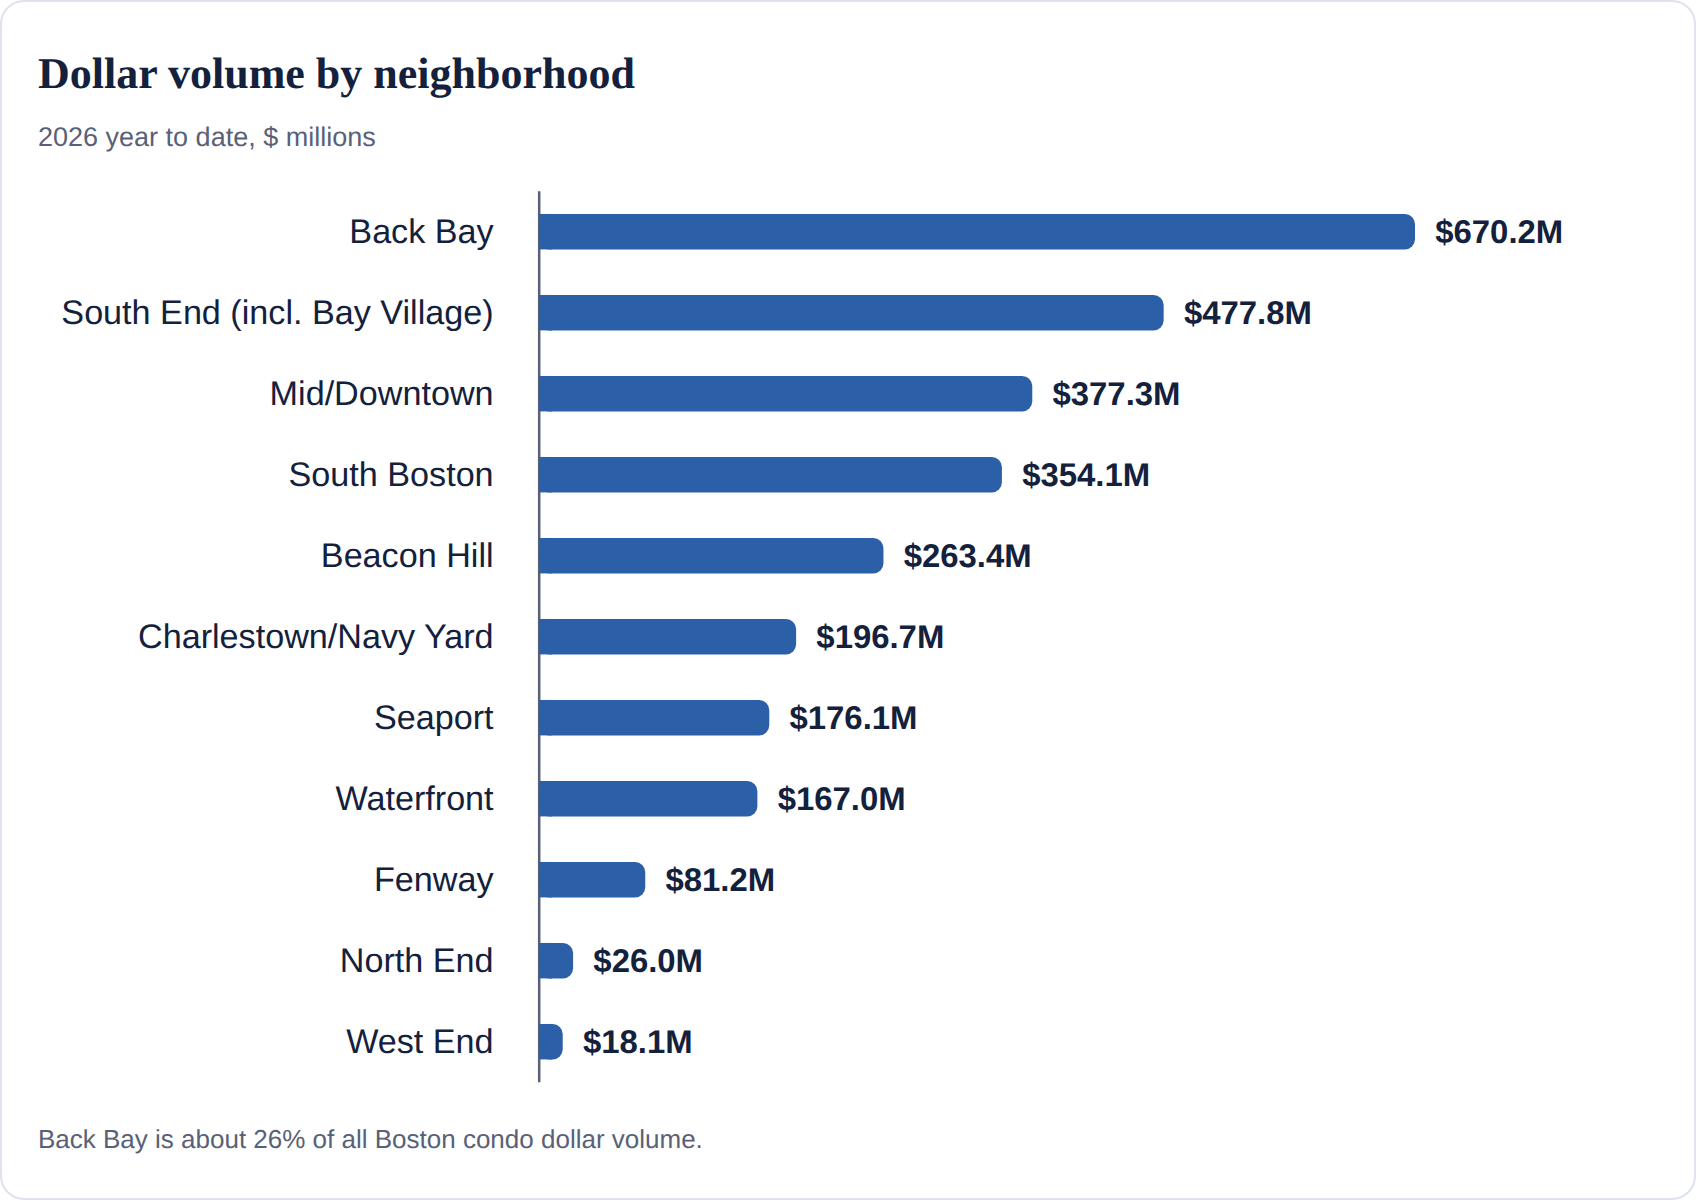
Back Bay remains the dollar leader at $670.2 million, about 26% of all condo volume. Mid/Downtown dollar volume rose 45% to $377.3 million, which is consistent with the wave of new-tower closings at Winthrop Center and the other downtown buildings covered below.
The price tiers tell the same story. Sales at $1 million and above are 53.5% of all closings, the first time that share has topped half in these reports, up from 47.4% last year. Closings at $1 million or more rose from 865 to 976, and $3 million to $9.99 million sales jumped from 117 to 161. Meanwhile, closings under $1 million fell from 960 to 849, and sub-$500,000 sales dropped by a third, from 153 to 103.
WHAT IT MEANS
The entry level of the Boston condo market is thinning while the upper tiers are widening. A buyer shopping under $1 million is competing for a shrinking pool of closed deals, and a seller above $1 million is finding a deeper buyer base than a year ago.
Search Boston homes by neighborhood
Each button opens a live search of current listings in that neighborhood.
Back Bay | Beacon Hill | South End | South Boston | Seaport | Charlestown | Mid/Downtown | North End | Waterfront
Luxury and new development
High-end Boston condo sales are rebuilding: 99 closings this year are at $2,000 per square foot or more, up from 75 in 2025 but still short of the 145 recorded at this point in 2023.
Across all Boston condos, closings at $1,000 per square foot or higher rose from 942 to 1,081, and those under $1,000 per square foot fell from 883 to 744. In the selected full-service buildings tracked in the report, 194 of 232 resales (84%) closed at $1,000 per square foot or more, 166 (72%) at $1 million or more, and 90 (39%) at $2 million or more.
The top of the resale market is led by a handful of buildings.
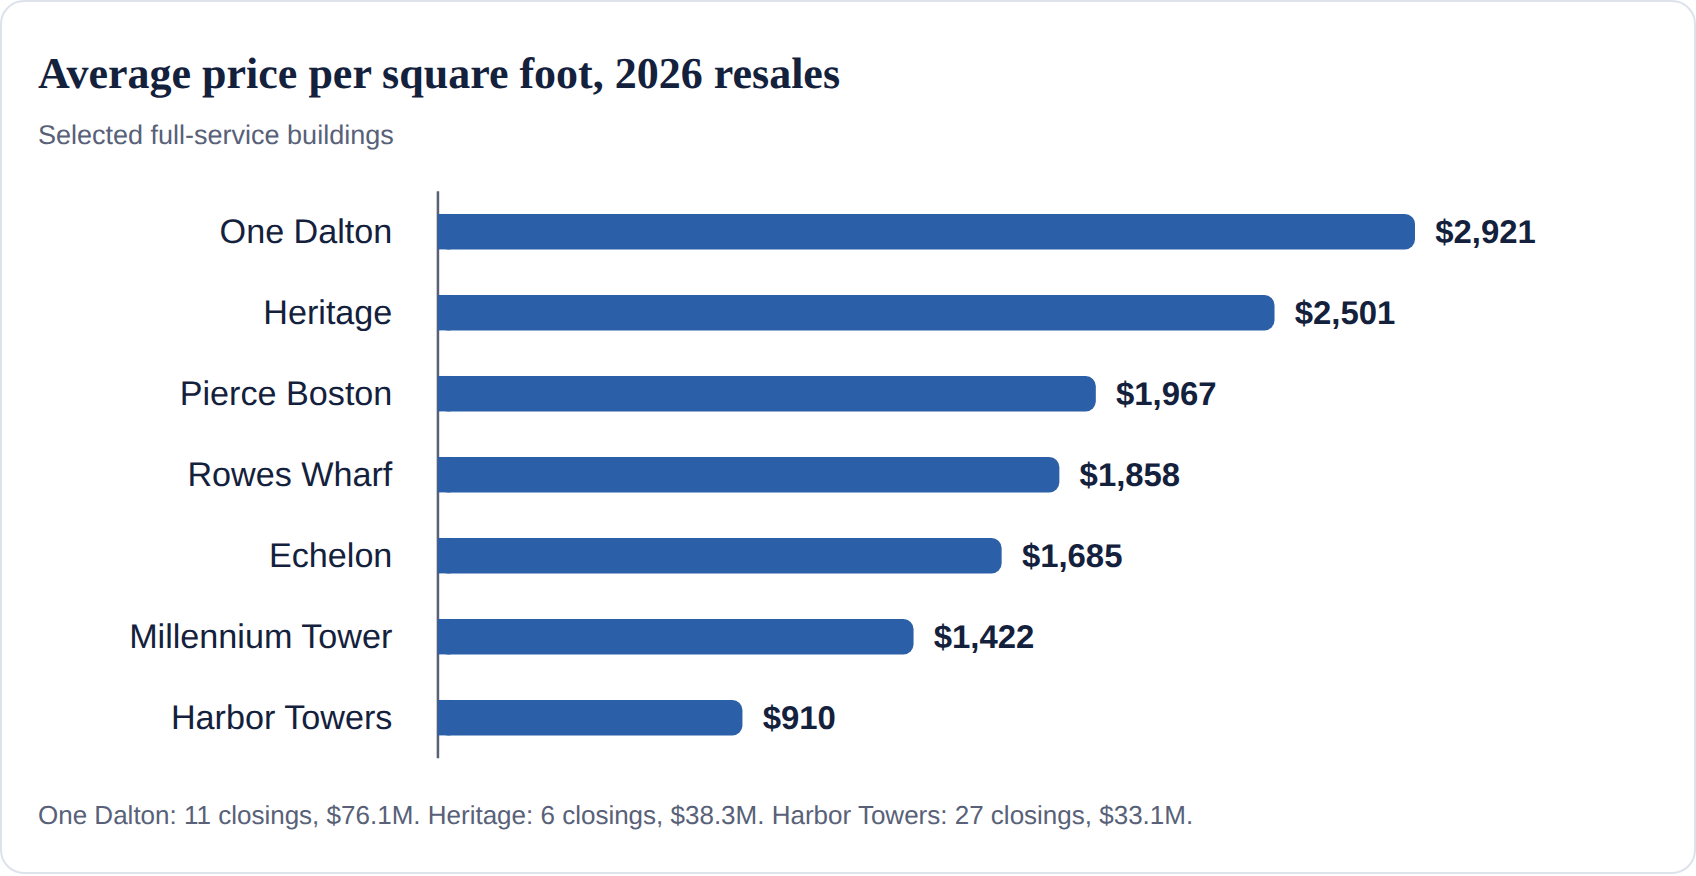
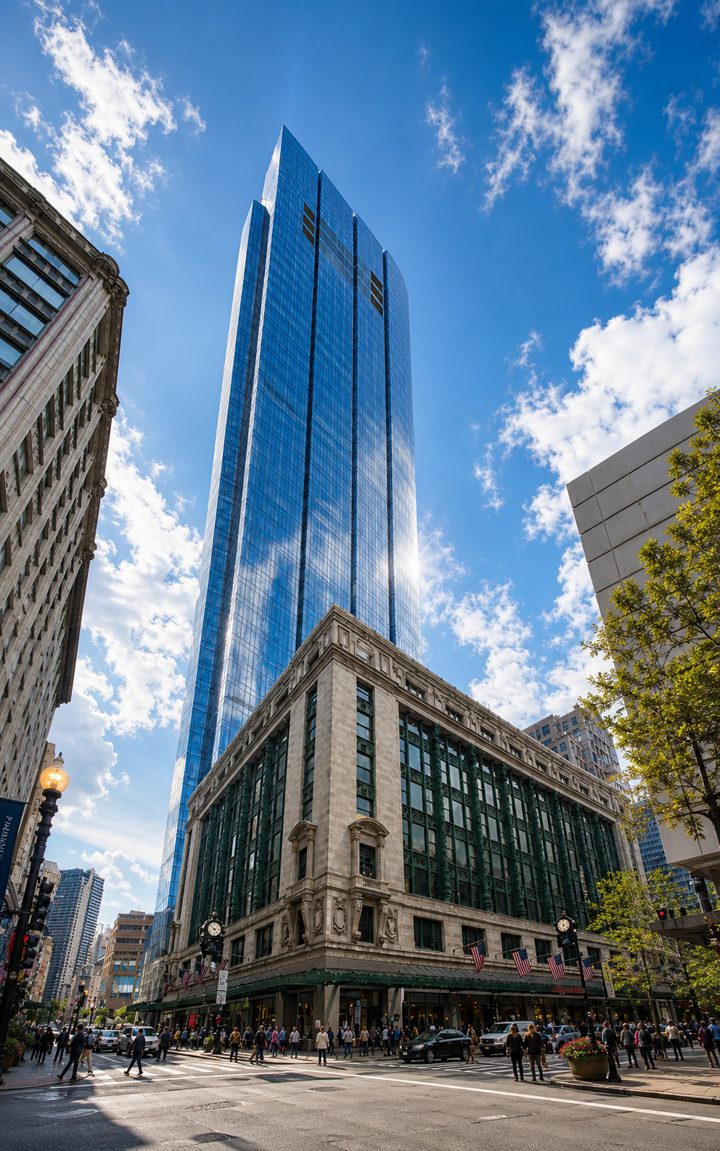
The year’s largest reported resale is a two-unit combination at Heritage (1005/1006) that closed August 28 for $21.5 million, about $4,323 per square foot. Two One Dalton units closed at $14 million each, and a 50 Liberty Wharf penthouse sold for $14.5 million.
New towers are adding to the total. Sales at buildings that are not yet sold out are shown below.
| NEW DEVELOPMENT (2026 CLOSINGS) | CLOSINGS | AVG. PRICE PER SQ. FT. | DOLLAR VOLUME | SHARE SOLD |
|---|---|---|---|---|
| The Ritz-Carlton Residences South Station | 39 | $2,252 | $110.4M | 24% |
| Winthrop Center | 27 | $2,076 | $86.9M | 46% |
| Raffles Boston | 7 | $3,269 | $30.5M | 86% |
| St. Regis | 8 | $1,769 | $23.6M | 62% |
| The Parker | 11 | $1,131 | $10.0M | 75% |
This week’s report added seven new closings, totaling about $15.0 million, at Heritage, Millennium Tower (two), Pierce Boston, One Dalton, FP3 and Winthrop Center.
WHAT IT MEANS
The luxury tier is not one market. Buildings such as One Dalton, Heritage and Raffles are commanding $2,500 to $3,300 per square foot, while Harbor Towers and Millennium Place sit near $900 to $1,035. Buyers and sellers should look at building-level comps, not a citywide average, because the spread between buildings is far larger than the change in the overall market.
Inventory and supply
Supply remains tight by the report’s own yardstick: Boston condos carry about 3.1 months of inventory on an MLS basis, well under the 5 to 6 months the report cites as the seller’s-market threshold.
That 3.1 months is the first-quarter 2026 reading, compared with 3.3 months a year earlier. On the full-service side, 151 resales are on the market across the tracked luxury buildings, with an average asking price of $3,586,460 and a median of $2,395,000. The average ask is $2,105 per square foot, and 128 listings are priced above $1,500 per square foot, 60 of them above $2,000. Echelon (28 listings) and Millennium Tower (17) have the most units for sale.
Asking prices are what sellers hope for, and closings are what buyers pay. At One Dalton, the ten resales currently listed ask between $2,653 and $5,081 per square foot, against a year-to-date closed average of $2,921. Sellers priced at or below recent closings are the ones matching real buyer demand.
One caution on comparing eras: the report notes that full-service inventory is now pulled from the MLS because downtown brokers increasingly use it, while earlier counts from the 2009 peak, year-end 2009 and year-end 2010 came from the LINK database. Treat comparisons to those years as directional, not exact.
WHAT IT MEANS
Low supply is what has kept prices firm while sales counts stay flat. If more listings arrive this fall, especially in the $1,500-plus per square foot tier where asks are concentrated, the balance could shift. For now, the data still favors sellers who price to recent closings.
What this means for you
The numbers reward precision: price to recent closings, compare at the building level, and read medians rather than averages.
For buyers
- Boston condos under $1 million are the tightest segment: closings below that line fell from 960 to 849 this year, so expect competition for well-priced units.
- In luxury buildings, the gap between asking and closed price per square foot is your negotiating guide. Ask for the building’s year-to-date closings before making an offer.
- Neighborhoods with falling closings, such as the South End and South Boston, may offer more choice than the downtown core, where activity is rising.
For sellers
- With Boston supply near 3 months, correctly priced homes are being absorbed. Pricing above the recent closed range is the main way to lose time.
- Top-tier sellers have the best year-over-year tailwind: Boston sales between $3 million and $10 million are up 38%.
- Building matters more than neighborhood at the high end. Use closings from your own building, not a citywide figure.
For trustees, executors and family fiduciaries
- Use medians, price per square foot and same-building closings when documenting value. New-development closings can push averages up, and the spread between buildings runs from about $900 to about $2,900 per square foot.
- Valuation dates matter. Boston’s average condo price moved 10.5% in a single year, so a valuation tied to an earlier date can differ meaningfully from today’s market.
- Several buildings have only a handful of closings this year, so a single sale can move a building’s average. Look at individual comparable sales before relying on a building average.
Thinking about your own property?
Catherine Bassick, Bassick Advisors at Douglas Elliman Real Estate. 617.800.7764 | catherine@bassickadvisors.com
Source: MLS. Boston condominium figures are closed sales reported through September 27, 2026, covering Back Bay, Bay Village, Beacon Hill, Chinatown, Charlestown/Navy Yard, Fenway, the Financial, Theatre and Leather Districts, Downtown and Midtown, North End, Seaport, South Boston, South End, West End and the Waterfront. Percentage changes are calculated from the reported figures. Data is taken from sources deemed reliable but is subject to errors and omissions.
Related Boston market report
Considering a home outside the city? Compare prices, sales and supply in our September 2026 housing market update for Wellesley, Weston, Newton, Needham, Natick and Dover.



Leave a comment