Boston Suburbs Housing Market Update — September 2026
Wellesley, Weston, Newton, Needham, Natick and Dover
By Catherine Bassick, Bassick Advisors at Douglas Elliman Real Estate. Published September 29, 2026.
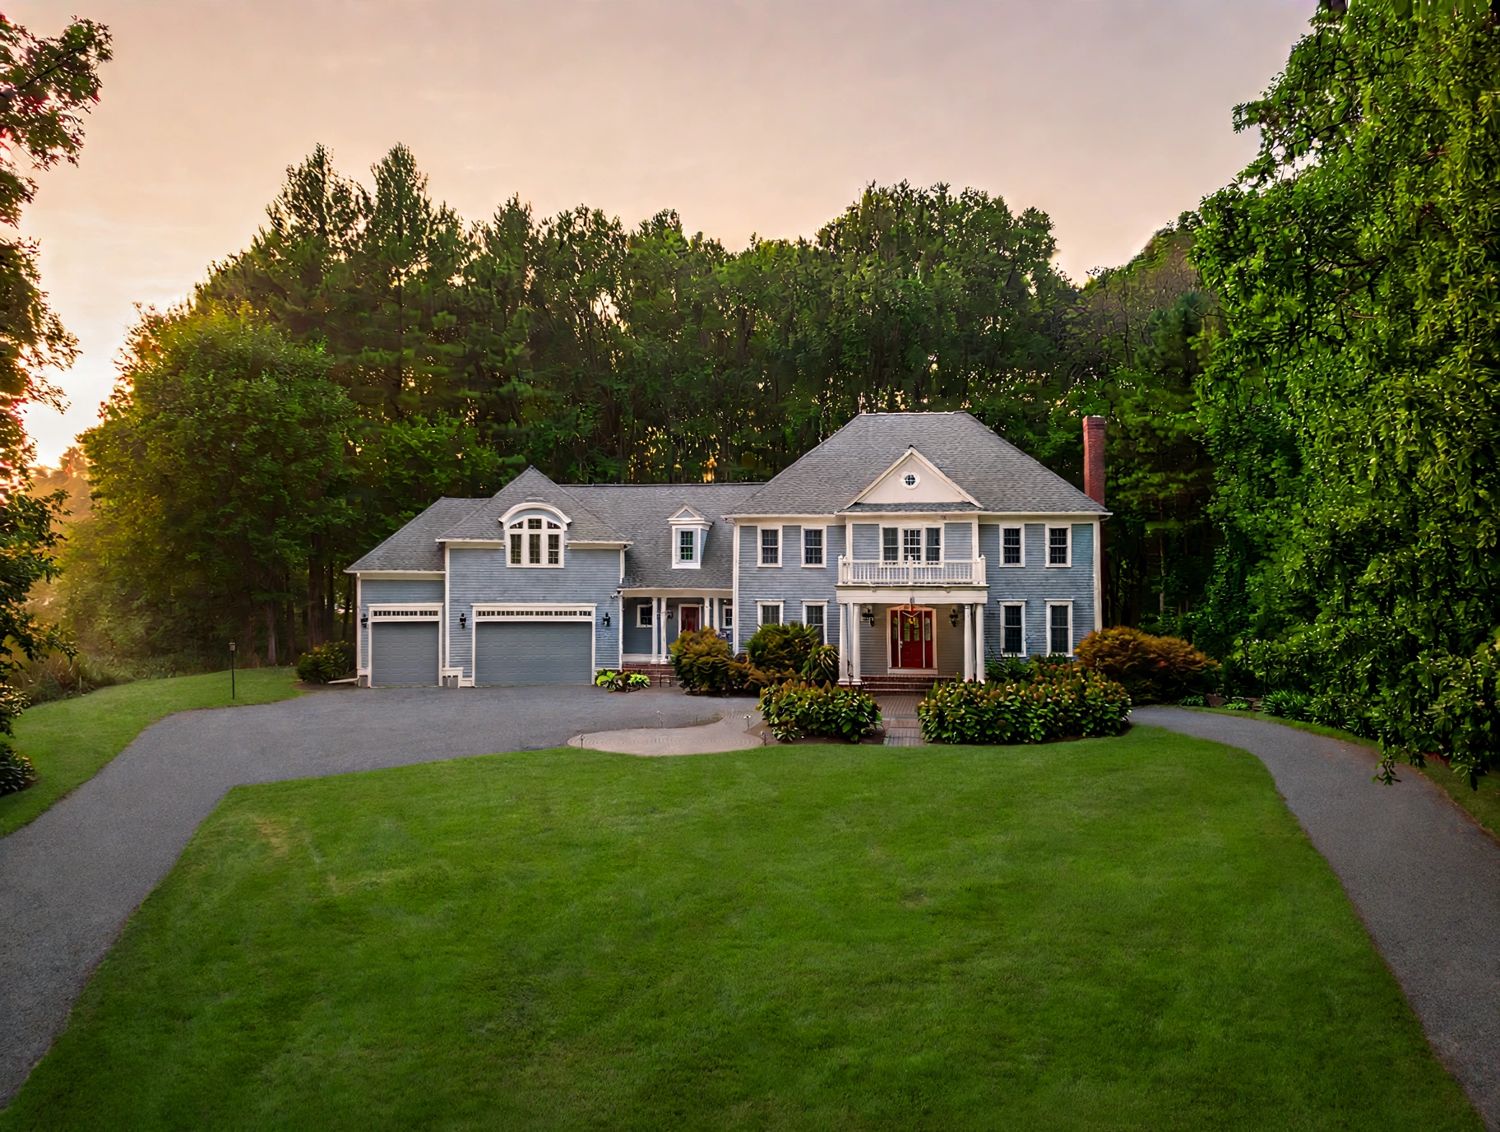
MARKET UPDATE · SEPTEMBER 2026 · DATA THROUGH SEPTEMBER 25
Six Boston suburbs, three different stories. Wellesley and Dover are rising, Newton and Weston are flat to lower, and Natick is the tightest market.
| WELLESLEY MEDIAN $2,400,000 ▲ 8.5% vs. 2025 |
DOVER MEDIAN $2,074,000 ▲ 8.9% vs. 2025 |
NATICK SUPPLY 1.9 months ● Tightest of the six |
WESTON AVERAGE PRICE +14.0% Median fell 2.2% |
The short version
- Wellesley (median $2,400,000, up 8.5%) and Dover (up 8.9% to $2,074,000) are rising. Weston, Newton, Needham and Natick are flat to slightly lower.
- Sales are down in five of the six towns, which points to a shortage of sellers more than a shortage of buyers.
- Natick (1.9 months) and Wellesley (2.2) are the tightest markets. Dover (6.3) is balanced.
- In Weston the average price rose 14.0% while the median fell 2.2%. A few $4 million-plus sales are lifting the average.
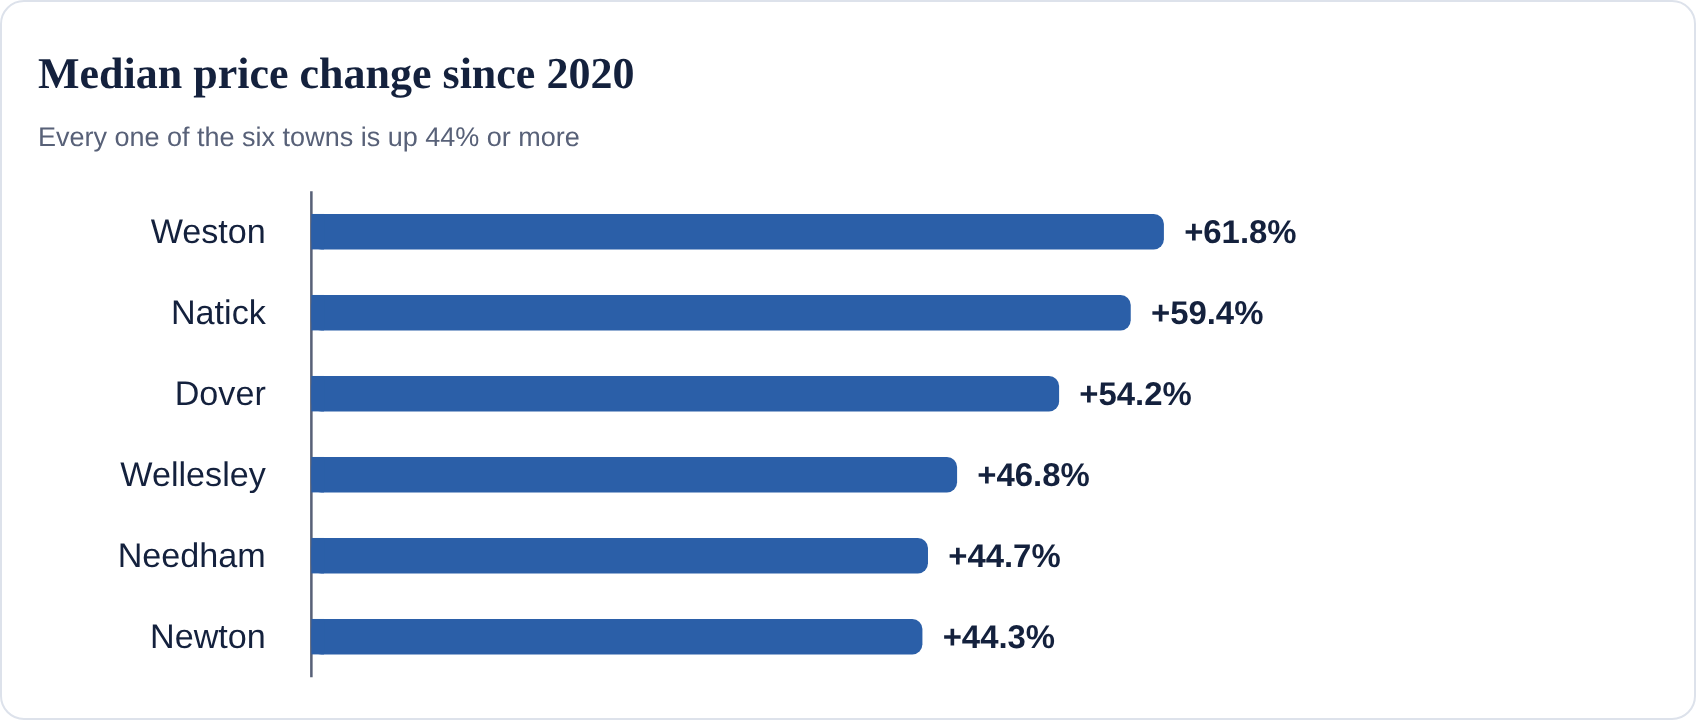
- Since 2020, every one of the six towns has posted a median gain of 44% or more.
Market at a glance
Wellesley and Dover are pushing prices up while Weston, Newton and Needham have slipped slightly, and Natick is the tightest market of the group.
Through September 25, the Wellesley median is $2,400,000, up 8.5% from last year, and Dover is up 8.9% to $2,074,000. Weston, Newton, Needham and Natick medians are flat to slightly lower. Sales counts are down in five of the six towns, which points to a shortage of sellers more than a shortage of buyers.
Since 2020, every one of the six towns has posted a median gain of 44% or more: Weston +61.8%, Natick +59.4%, Dover +54.2%, Wellesley +46.8%, Needham +44.7% and Newton +44.3%.
Six towns compared
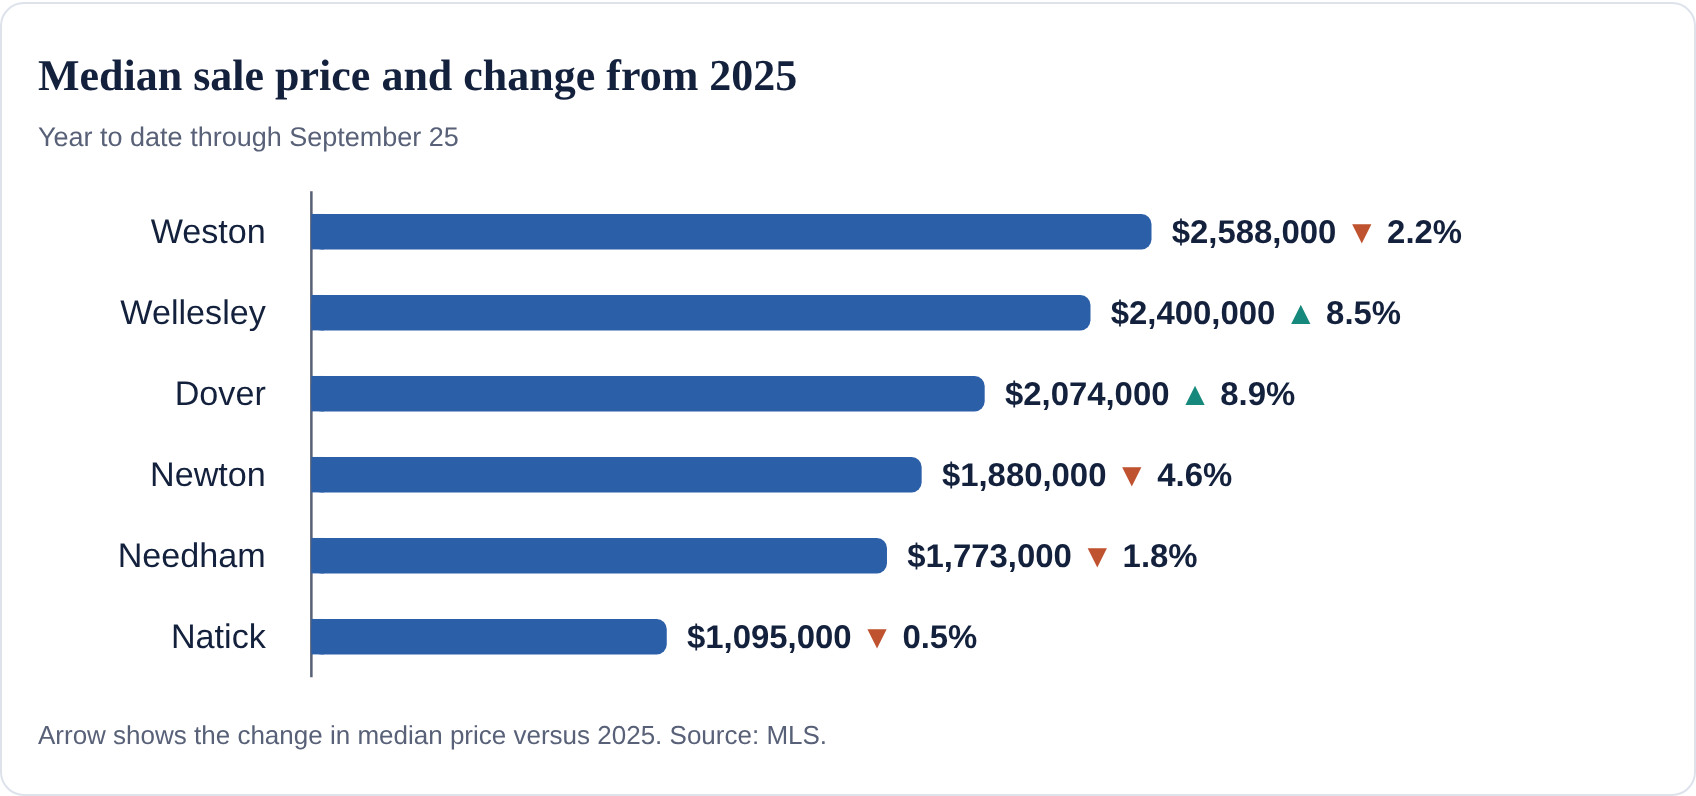
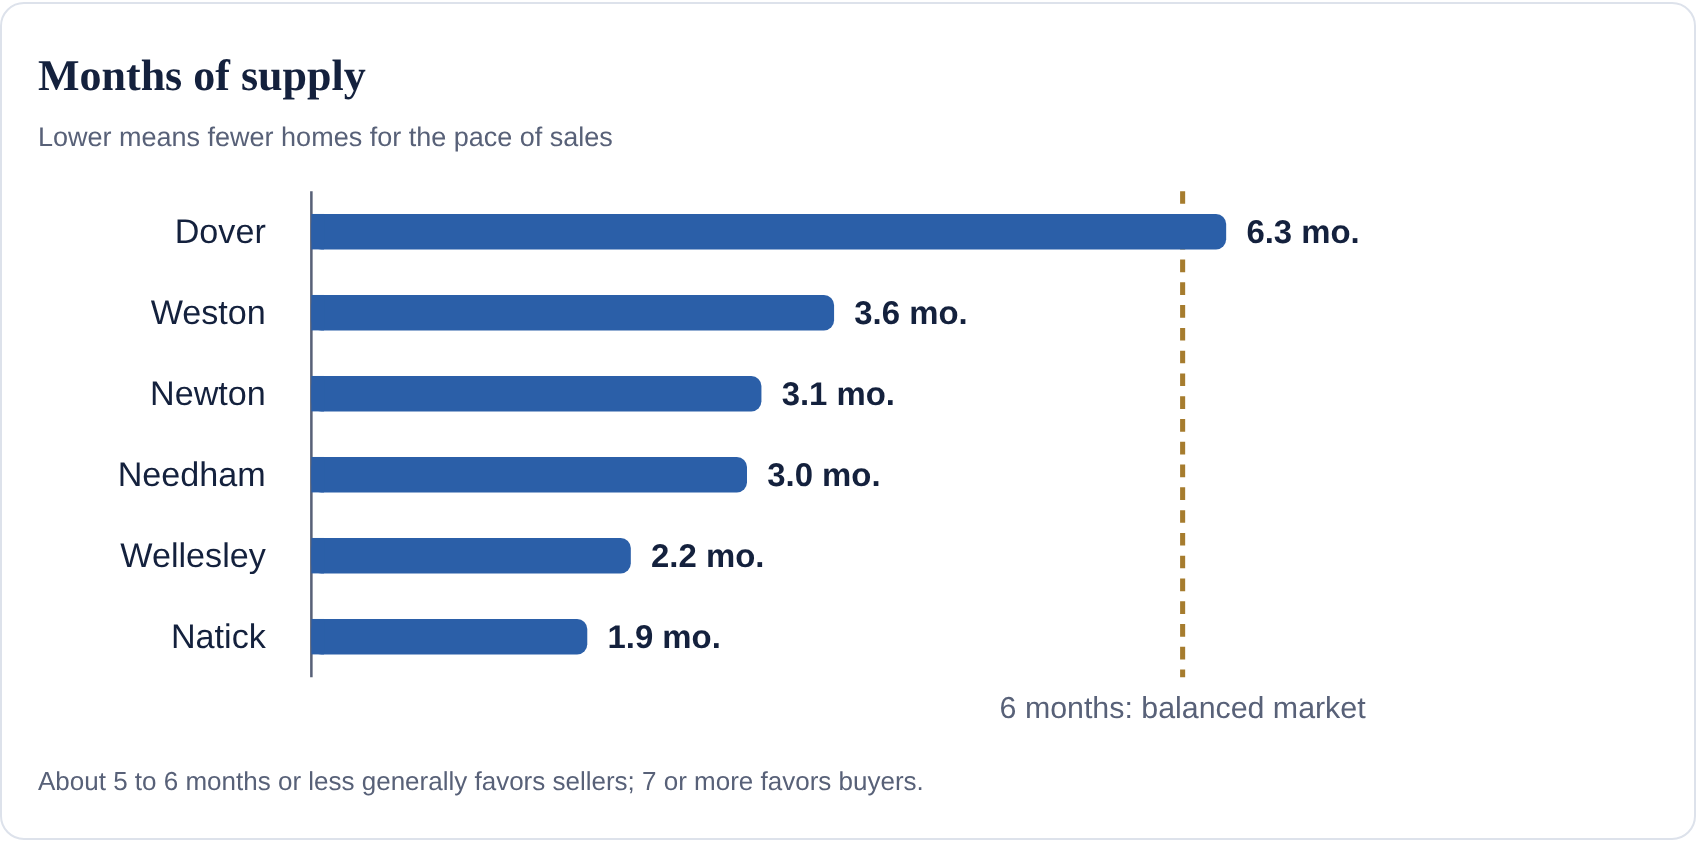
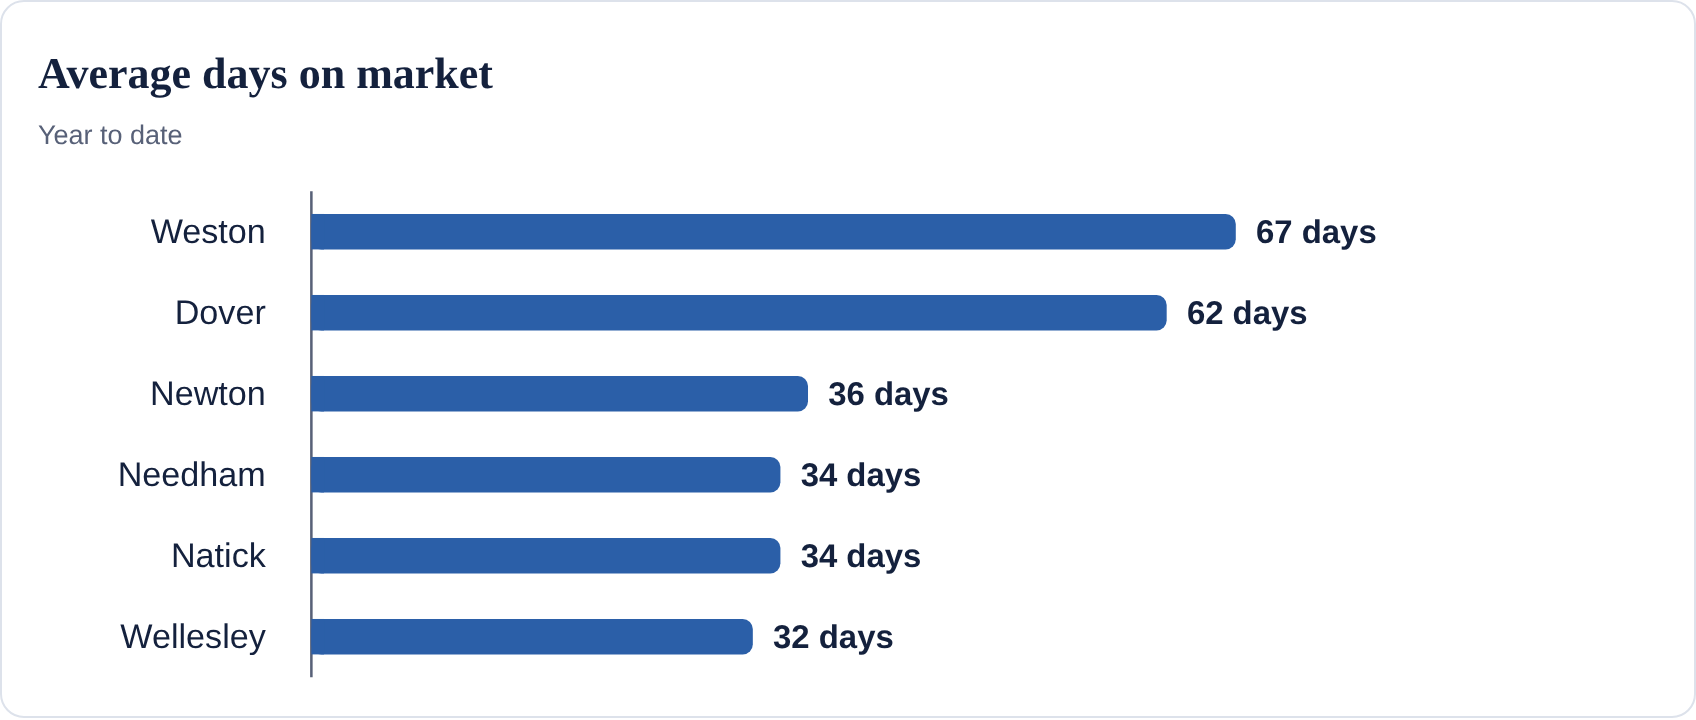
| TOWN (YEAR TO DATE, SEPT. 25) | SALES | CHANGE VS. 2025 | MEDIAN PRICE | CHANGE VS. 2025 | AVG. DAYS ON MARKET | MONTHS OF SUPPLY |
|---|---|---|---|---|---|---|
| Weston | 80 | -5.9% | $2,588,000 | -2.2% | 67 | 3.6 |
| Wellesley | 192 | -8.6% | $2,400,000 | +8.5% | 32 | 2.2 |
| Dover | 48 | +6.7% | $2,074,000 | +8.9% | 62 | 6.3 |
| Newton | 366 | -4.7% | $1,880,000 | -4.6% | 36 | 3.1 |
| Needham | 194 | -3.0% | $1,773,000 | -1.8% | 34 | 3.0 |
| Natick | 216 | -2.3% | $1,095,000 | -0.5% | 34 | 1.9 |
A common rule of thumb is that under 5 to 6 months of supply favors sellers, about 6 months is balanced, and 7 or more favors buyers. By that yardstick, five of the six towns lean toward sellers, with Natick, Wellesley, Needham and Newton under 3.2 months, and Dover sits at the balanced line.
Town by town
Wellesley is the strongest performer. The median is $2.4 million, up 46.8% from $1,635,000 in 2020, and homes are selling in 32 days on average. Sales at $3 million and above rose from 45 to 62, and those at $4 million and above from 18 to 30, so the move up is being driven by the top end. With 2.2 months of supply, it favors sellers.
Weston shows how averages can mislead. The average price jumped 14.0% to $3,388,000, yet the median slipped 2.2%. Sales at $4 million and above rose from 14 to 18, which pulls the average up while typical homes are not appreciating. Homes are taking longer to sell (67 days versus 52 last year), but supply has improved from 5.8 months to 3.6 as inventory fell from 49 listings to 37.
Dover is up 8.9% in median price on a small sample of 48 sales, but it is also the softest market on supply. At 6.3 months, it sits at the balanced-market line, with 32 active listings versus 28 a year ago and 62 average days on market.
Search homes in Dover (link coming soon)
Newton and Needham are steady rather than strong. Newton’s median is down 4.6% to $1,880,000, though price per square foot is up 1.3% to $628. Needham’s listings rose 24% from 50 to 62, lifting supply from 2.7 to 3.0 months.
Search homes in Newton | Search homes in Needham
Natick is the value-priced, high-demand pocket. The median is essentially flat at $1,095,000, and at 1.9 months it has the least supply of the six.
WHAT IT MEANS
A town’s headline median is only part of the picture. The upper end of Wellesley is pulling that market ahead, while Weston and Dover buyers have more room to negotiate. In the towns with median declines of a few percent, price per square foot is still rising modestly, which suggests a shift in what is selling rather than a drop in value.
What this means for you
The numbers reward precision: price to recent closings, compare at the town and price-tier level, and read medians rather than averages.
For buyers
- Dover (6.3 months of supply) and Weston (67 average days on market) offer the most negotiating room.
- Natick (1.9 months) and Wellesley (2.2 months) are the most competitive, so be ready to move on well-priced homes.
- Needham’s inventory is up 24% year over year, which gives buyers more choice than last year.
For sellers
- Where the market is flat, the sale often turns on condition and positioning. Newton, Needham and Natick medians are down or flat, so plan around closed comparables rather than last year’s headline number.
- Wellesley’s top end has the strongest tailwind: sales at $4 million and above are up 67%.
- In Weston and Dover, longer days on market mean pricing discipline matters most.
For trustees, executors and family fiduciaries
- Use medians and price per square foot when documenting value. In Weston, the average rose 14.0% while the median fell 2.2%, so an average can overstate what a typical property is worth.
- Timing a disposition depends on the town. Supply is tightest in Natick and Wellesley and softest in Dover and Weston, which affects how long a property is likely to take to sell and how aggressively to price it.
- Small samples (Dover had 48 sales, Weston 80) can swing sharply from a few transactions, so treat their year-over-year percentages with caution.
Thinking about your own property?
Catherine Bassick, Bassick Advisors at Douglas Elliman Real Estate. 617.800.7764 | catherine@bassickadvisors.com
Source: MLS. Figures are year-to-date through September 25, 2026 for Wellesley, Weston, Newton, Needham, Natick and Dover. Percentage changes are calculated from the reported figures. Data is taken from sources deemed reliable but is subject to errors and omissions.
Related Boston market report
Comparing suburban homes with city condos? Read our September 2026 Boston condo market update for Back Bay, Beacon Hill, South End and Seaport.



Leave a comment