• San Francisco’s Transit Housing Laws Just Rewrote the Rules for Mission District Land

    The bottom line

    California now allows by-right mid-rise housing near BART and other major transit — and with San Francisco one-bedrooms at a record $4,400 a month, well-located Mission District development land has rarely been this valuable.

    Something remarkable is happening in San Francisco real estate, and it is happening on two tracks at once. On the policy track, the state and the city have spent the last year rewriting the rules for what can be built near transit. On the market track, rents just hit record highs — a median one-bedroom now costs $4,400 a month, up more than 25% in a single year. When policy tailwinds and market demand point in the same direction, land values follow.

    For anyone who owns, is considering buying, or holds in trust a development site in the Mission District or near any major San Francisco transit stop, this convergence deserves your full attention.

    SB 79: by-right housing near transit is now state law

    Senate Bill 79, which took effect July 1, 2026, is the most consequential housing law California has passed in years. It allows qualifying transit-oriented housing near certain rail and bus rapid transit stops — including BART stations — to be approved by right, meaning without the discretionary hearings and political gauntlet that have historically killed or delayed San Francisco projects.

    The key provisions:

    • On qualifying parcels within a half-mile of major transit stops, developers can build mid-rise housing — up to nine stories (95 feet) within 200 feet of the station, seven stories within a quarter-mile, and six stories out to a half-mile.
    • Projects that meet the law’s criteria receive streamlined, ministerial approval — dramatically shortening the entitlement timeline.
    • The law applies in urban transit counties including San Francisco, and it stacks with state density bonus law, so a well-structured project can exceed even the new base allowances.

    There are real constraints to underwrite. Buildings taller than 85 feet trigger prevailing-wage requirements that add an estimated 30–35% to labor costs — developers tell me this can make market-rate projects pencil out only with subsidy, so many will design to stay under that threshold. And San Francisco itself is currently being sued over how it is implementing the law, with cities seeking carve-outs for industrial employment hubs. Legal clarity is still forming, and any buyer should verify a specific parcel’s eligibility with land-use counsel.

    San Francisco’s Family Zoning Plan raised the local baseline

    Layered under SB 79 is the city’s own Family Zoning Plan, adopted in December 2025. It upzoned corridors across the city — largely in the northern and western neighborhoods — to allow 6 to 10 stories of housing where far less was permitted before, with heights up to 350 feet along parts of Van Ness. The local plan left much of the Mission alone as an equity-priority area — which is exactly where SB 79’s state-level transit rules fill the gap, calling for zoning changes along Valencia and Guerrero streets near BART.

    Why this matters for a buyer: the Family Zoning Plan raises the local base zoning, which in turn raises what state density bonus law can be stacked on top of it. The two laws multiply each other. The plan is facing legal challenges from both pro-housing groups and neighborhood opponents, so its final contours may shift — but the direction of travel is unmistakable.

    AB 2074 just raised the ceiling again

    Governor Newsom has signed Assembly Bill 2074 into law. It requires California’s seven largest transit-rich cities — including San Francisco — to designate regional transit hub districts with minimum 150-foot residential height limits, and at least a quarter of those districts zoned up to 450 feet. That pushes allowable heights near major transit well beyond even what SB 79 permits. For a Mission site near BART, this is pure option value: every additional foot of allowable height is additional residual land value.

    The demand side: $4,400 for a one-bedroom

    Policy only creates value if the market can absorb what gets built. Zumper’s September report says it can — emphatically:

    • The median San Francisco one-bedroom rent hit $4,400 a month — a record high, up 25.4% year over year, and nearly closing the gap with New York City.
    • The median two-bedroom reached $6,340 — the highest in the United States, nearly $900 more than New York.
    • Zumper attributes the surge directly to hiring in the AI sector, which is pulling high earners back into the city while there is very little new supply to absorb them.
    • Active rental listings are down roughly 30% year over year, as existing tenants stay put rather than risk higher rents elsewhere.

    Rising rents are a genuine hardship for tenants — Mayor Lurie recently declared a “rent emergency” as evictions climb — and I never lose sight of that. But for the development equation, the signal is unambiguous: demand for well-located San Francisco housing is deep, supply is constrained, and new transit-oriented homes will lease.

    New mid-rise mixed-use housing under construction near a San Francisco transit station
    New mid-rise housing rising near transit — the building type SB 79 and the Family Zoning Plan are designed to accelerate.

    Case in point: a Mission assemblage at the center of it all

    Consider the nearly two-acre assemblage at Valencia Street and Cesar Chavez — marketed as 3550 Cesar Chavez — currently offered at $58 million. It sits roughly four-tenths of a mile from the 24th Street Mission BART station, squarely inside SB 79’s half-mile zone, in the Valencia Neighborhood Commercial Transit district.

    This is precisely the profile the new laws were written for: a large, transit-adjacent site on a commercial corridor where by-right mid-rise housing is now the state’s stated policy. The listing’s marketing already references the “evolving transit-oriented development environment” — and with SB 79 now in effect, that phrase has a specific, citable statute behind it. Any buyer will still need to verify parcel-level eligibility, wage thresholds, and inclusionary requirements with their own counsel — but the policy backdrop has shifted from headwind to tailwind.

    What This Means for Your Property

    For buyers

    If you are a developer or investor hunting for San Francisco sites, the map that matters most right now is the transit map. Parcels within a half-mile of BART and other qualifying stops carry a by-right entitlement path that simply did not exist two years ago. Underwrite carefully — prevailing-wage thresholds, inclusionary housing requirements, and the pending lawsuits all affect the pro forma — but the entitlement risk that historically defined San Francisco development is lower than it has been in a generation. And with one-bedrooms at $4,400, the revenue side of the model is the strongest in the city’s history.

    For sellers

    If you own development land near transit, the policy environment is doing some of your marketing for you. A site that was worth “what the zoning allows” is now worth what state law allows — and state law allows considerably more. Price with the tailwind, but be transparent: sophisticated buyers will discount for legal uncertainty until the courts settle the current challenges. The strongest position is a well-documented site with a clear-eyed entitlement narrative.

    For trustees, executors, and family fiduciaries

    Land held in trust near a transit corridor may be worth materially more than its last appraisal reflected. If you have a fiduciary duty to the beneficiaries of an estate holding Mission District or other transit-adjacent property, these law changes are exactly the kind of material development a prudent fiduciary investigates. An updated valuation — and a conversation about whether the current holding strategy still serves the beneficiaries — is in order.

    San Francisco Development Brief: 4 Land-Use Measures Up for Votes October 5–6, 2026

    San Francisco’s Board of Supervisors has published final agendas for two consequential land-use hearings on October 5 and October 6, 2026. Four measures — CEQA streamlining, mezzanine reform, residential ceiling-height standards, and a data-center moratorium — are scheduled for committee hearings or a first Board reading. Here is what each San Francisco development measure would do, and what it means for Mission District property owners and housing development.

    1. CEQA streamlining heads to the full Board of Supervisors (Board File 260539)

    Board File 260539, a CEQA streamlining ordinance, is scheduled for its first Board of Supervisors reading on Tuesday, October 6, 2026, at 2:00 p.m. The measure would shorten certain CEQA appeal periods from 30 days to 15 days, remove shadow analysis as a specifically identified local environmental impact, and eliminate some local procedures that exceed state CEQA requirements. (Source: sfgov.legistar.com)

    What it means: If passed, the ordinance would reduce local procedural risk and could shorten entitlement timelines for taller housing and mixed-use projects in San Francisco. It would not eliminate state CEQA compliance obligations or the risk of environmental litigation.

    2. Mezzanine reform returns to the Land Use and Transportation Committee (Board File 260709)

    Board File 260709, the mezzanine reform ordinance, is scheduled for the Land Use and Transportation Committee on Monday, October 5, 2026, at 1:30 p.m. The amended ordinance would allow a mezzanine covering up to one-half of the floor area below without automatically counting as a separate story, replacing the current one-third threshold. The committee amended and continued the measure on September 28; October 5 is its next scheduled opportunity to advance. (Source: sfgov.legistar.com)

    What it means: The change could improve usable-area efficiency for adaptive reuse projects, institutional redevelopment, high-ceilinged commercial space, and mixed-use projects constrained by story-count limits. It does not independently increase zoning height or FAR (floor area ratio).

    3. Lower minimum residential ceiling heights scheduled for committee vote (Board File 260623)

    Board File 260623, which would lower San Francisco’s minimum residential ceiling heights to seven feet for habitable rooms and six feet eight inches for other rooms, is also scheduled for the October 5 committee hearing. The proposal remains pending and has not been enacted. (Source: sfgov.legistar.com)

    What it means: This incremental adaptive-reuse reform could allow portions of older commercial or institutional buildings — those with constrained floor-to-floor dimensions, beams, or mechanical systems — to qualify for residential occupancy without costly structural alterations.

    For the 1500 Valencia / 3500 Cesar Chavez assemblage in San Francisco’s Mission District, the ceiling-height measure is more relevant to a partial-reuse scenario than to ground-up development. No project-specific eligibility should be assumed.

    4. Proposed 45-day data-center moratorium gets its first hearing (Board File 261021)

    Board File 261021, a proposed 45-day citywide moratorium on data centers in San Francisco, is scheduled for the October 5 committee hearing. The official file now lists the measure as “Scheduled for Committee Hearing.” It remains an urgency ordinance and is not operative law.

    What it means: If adopted, the moratorium would temporarily remove new data centers and data-center expansions from near-term alternative-use analysis for large commercial, industrial, and institutional sites. It would not restrict housing, hospitality, medical, or conventional mixed-use redevelopment.

    For the Valencia/Cesar Chavez assemblage, the practical effect remains limited: the strongest investment case is transit-oriented housing, mixed-use, hospitality, or institutional redevelopment — not data-center use.

    Bottom line: Taken together, the October 5–6, 2026 San Francisco land-use agenda pairs potential design flexibility (mezzanine and ceiling-height reform) with shorter procedural exposure (CEQA streamlining). None of these four measures is operative law yet.

    Frequently Asked Questions

    Does SB 79 apply to my property?

    It may, if the parcel is in an urban transit county like San Francisco and sits within a half-mile of a qualifying rail or bus rapid transit stop (200 feet for the tallest height tier), and the project meets the law’s criteria. Parcel-level verification with land-use counsel is essential — the law has specific eligibility requirements and local implementation is still being litigated.

    Does “by-right” mean no public process at all?

    By-right means the project is approved ministerially — without discretionary hearings — if it meets the objective standards. Environmental review is streamlined, though not eliminated in every case. It is a dramatically faster path than traditional San Francisco entitlements, not an absence of process.

    What about affordable housing requirements?

    Inclusionary housing requirements still apply to new residential development in San Francisco. The city has recently reduced some fees and requirements on market-rate projects to improve feasibility, but the specifics vary by project type and size. This is a line item every pro forma must carry.

    Is the Family Zoning Plan final?

    It was adopted in December 2025 but faces lawsuits from both pro-housing advocates and neighborhood groups, so its final form may change. The state laws (SB 79, and AB 2074, now signed into law,) operate independently of the local plan, which provides some insulation for transit-adjacent sites.

    I’m a neighbor, not a developer. Will this change my block?

    Gradually, and that is the point. The laws are designed to add homes along corridors and near transit rather than in the middle of residential blocks — think apartments over the shops on Valencia, not towers on your street. More neighbors near transit means more customers for local businesses and more riders supporting the transit system itself.

    Sources and Methodology

    Policy and market data in this post are drawn from current reporting and public records, checked October 1, 2026. Rent figures are from Zumper’s September 2026 national rent report as covered by CBS News. Statutory summaries reflect SB 79 (effective July 1, 2026), San Francisco’s Family Zoning Plan (adopted December 2025), and AB 2074 (signed into law in late September 2026) — all subject to pending litigation and implementation guidance. Site details for the Cesar Chavez assemblage are from the public MLS listing; entitlement eligibility must be verified parcel by parcel.

    Browse properties: San Francisco · Marin County — each link opens a live search of current listings in that area.

    Contact Catherine Bassick for a confidential conversation about what these policy changes mean for your property — whether you own development land, are considering a purchase near transit, or hold real estate in trust.

  • Bay Area Real Estate Market Update August 2026

    What changed this month

    Bay Area inventory is building and sales pace is cooling into late summer, even though San Mateo and Alameda prices are still inching up.

    A buyer looking in San Francisco, on the Peninsula or in Marin can encounter very different conditions within a relatively short drive. The August figures show just how much location and property type matter to a successful purchase or sale.

    Among the five counties in this comparison, San Mateo recorded the highest median detached-home price and the shortest median selling time. San Francisco had the least available supply relative to sales. Marin offered more inventory and a longer selling cycle, even as its median price rose from a year earlier.

    As your real estate advisor, my job is to put those numbers into perspective for your property and your plans. A county median is useful context. The value of an individual home still depends on its neighborhood, condition, design and competition.

    Five Counties, Five Different Markets

    Median sale price

    Line chart of median detached-home sale price by county, January 2025 to August 2026 — San Mateo leads at $2.25M, about 75% above Alameda's $1.29M

    Source: C.A.R. county reports as compiled in the original report. January 2025–July 2026 points are estimates; August 2026 reflects the reported snapshot.

    Months of supply

    Line chart of unsold inventory in months of supply by county, January 2025 to August 2026 — Marin's inventory of 2.7 months runs over 2x San Francisco's 1.3 months

    Source: C.A.R. county reports as compiled in the original report. January 2025–July 2026 points are estimates; August 2026 reflects the reported snapshot.

    Median days on market

    Line chart of median days on market for closed sales by county, January 2025 to August 2026 — Marin homes take 56 days to sell, about 5x San Mateo's 11-day pace

    Source: C.A.R. county reports as compiled in the original report. January 2025–July 2026 points are estimates; August 2026 reflects the reported snapshot.

    The following August 2026 figures are from the California Association of REALTORS® county reports and cover detached homes. Price changes compare August 2026 with August 2025.

    CountyMedian pricePrice changeSupplyMedian days
    San Francisco$1,875,000+25.0%1.3 months34
    San Mateo$2,250,000+13.2%1.7 months11
    Santa Clara$1,900,0000.0%2.1 months12
    Alameda$1,285,000+1.3%2.3 months14
    Marin$1,650,500+8.4%2.7 months56

    Months of supply measures how long available inventory would last at the reported sales pace. It helps explain the balance between buyers and sellers, although that balance can vary considerably by neighborhood and price range.

    San Mateo and Santa Clara Move Quickly

    San Mateo’s $2.25 million median price was the highest in this five-county comparison. With a median selling time of 11 days and 1.7 months of supply, its August results suggest limited room for hesitation on competitively priced properties.

    Santa Clara followed closely at 12 median days on market. Its $1.9 million median price was unchanged from August 2025. That combination is a useful reminder that a fast-moving market does not necessarily produce a rising county median every month.

    Marin Offers More Time to Consider a Purchase

    Marin recorded 2.7 months of supply and a median selling time of 56 days, the highest readings among these five counties. Its median price nevertheless rose 8.4% from a year earlier to $1,650,500.

    For buyers, those figures suggest more time to evaluate options than in San Mateo or Santa Clara. For sellers, they underscore the importance of realistic pricing and thoughtful preparation. More inventory does not guarantee a discount, and a rising median does not guarantee a quick sale.

    Alameda had the lowest median price in the comparison at $1,285,000, up 1.3% year over year. With 2.3 months of supply and 14 median days on market, it also illustrates why affordability and selling speed should be considered separately.

    Sailboats at a Marin County waterfront marina with San Francisco across the bay

    Marin County waterfront, with sailboats and San Francisco across the bay. Photograph supplied by Catherine Bassick. Used exactly as supplied.

    Inside San Francisco, Property Type Matters

    A separate set of SFAR MLS and Realtors Property Resource® reports provides a closer look at San Francisco by property type. These figures should be read within that reporting series. The source report does not reconcile its coverage and calculation methods with the CAR county series, so their medians and selling times should not be combined.

    August 2026 metricSingle-family homesCondos, townhouses, apartments
    Median sold price$1,700,000$1,160,500
    Reported sold-to-list ratio123.3%106%
    Median days on market3045
    Months of supply1.292.38

    Source: SFAR MLS / RPR Market Activity and Market Trends reports, as compiled in the accompanying August 2026 report.

    The difference in supply is substantial. Single-family homes had 1.29 months of inventory, compared with 2.38 months for the combined condo, townhouse and apartment category. That supports a stronger seller position for single-family homes at the citywide level.

    The reported 123.3% sold-to-list ratio for single-family homes also deserves context. Asking prices are part of a marketing strategy and may be set below expected sale prices. A sale above asking does not, by itself, establish that a buyer paid above market value or that every seller can expect the same premium.

    The combined condo category recorded a $1,160,500 median sold price and 45 median days on market. Buyers had more breathing room than in the single-family segment, but each building requires its own analysis, including association finances, insurance, assessments and financing considerations.

    I would draw few conclusions from the co-op figures this month. The report identifies very limited activity, making the results particularly sensitive to which individual properties traded.

    What These Numbers Mean for Your Property

    For buyers

    For buyers, preparation matters most in the markets moving quickly. Understanding financing, reviewing available disclosures and defining your priorities early can help you act confidently when the right property becomes available.

    For sellers

    For sellers, limited supply is an advantage only when the property is positioned well. Buyers still compare condition, location and price. I would use recent comparable sales and the homes competing with yours today to establish a pricing strategy, rather than applying a countywide percentage increase to a previous valuation.

    For trustees, executors and family fiduciaries

    For trustees, executors and families managing an estate, these differences also affect planning. A longer expected marketing period can change carrying costs and the timing of a distribution. Market statistics help frame that discussion, but an estate property needs an analysis appropriate to the asset and the purpose of the valuation.

    What I Am Watching This Fall

    Inventory is the measure I will be watching most closely. The August snapshot shows limited supply in San Francisco and San Mateo, but the next question is how much new choice buyers will have as the fall market develops.

    Home sales compared with a year earlier

    Bar chart of home sales year-over-year percent change by county, January 2025 to August 2026 — Santa Clara sales fell 13% while Marin rose 13.6%

    Original graph retained unchanged. Historical points are estimates. Its August labels differ from the report’s table: San Francisco −3.8% versus −3.2%; San Mateo +1.3% versus +1.5%; Alameda −8.9% versus −8.8%; Marin +13.5% versus +13.6%. The article uses the table figures.

    I will also be watching whether new listings translate into accepted offers and completed sales. The CAR figures show that August sales volume fell 3.2% year over year in San Francisco, 13.0% in Santa Clara and 8.8% in Alameda, while rising 1.5% in San Mateo and 13.6% in Marin. Price, supply and transaction volume each tell a different part of the story.

    My advice is to begin with the property and the decision you need to make. A home in Pacific Heights, a Peninsula estate and a Marin residence may require very different approaches, even when they appear under the same Bay Area headline.

    Considering a sale or purchase in San Francisco, the Peninsula or the greater Bay Area? I would be pleased to discuss what these figures mean for your property and your plans. Contact Catherine Bassick

    Browse properties: San Francisco | Marin | Atherton | Woodside | Menlo Park | Palo Alto

    Each link opens a live search of current listings in that area.

    San Francisco Luxury Defied the National Trend in August 2026

    San Francisco was the only major U.S. market where the priciest August home sales closed above asking, according to Homes.com’s analysis of the most expensive publicly marketed transactions.

    Three of the five sold above asking, led by a Pacific Heights Victorian that closed at $6.63 million, 66% above its $4 million list price. Homes.com attributes the result to continued competition for luxury homes, supported by AI-related growth in buyer demand and limited available inventory.

    The national picture ran the other way. Across nearly two dozen markets analyzed, the top transactions averaged 6% — about $906,000 — below original asking. In Boston, Tampa, Phoenix, Denver, Atlanta, and Miami, each of the five leading sales closed below asking. Boston’s priciest August sale was $14.3 million.

    What it means for your property: San Francisco luxury is a market apart. For sellers of exceptional, well-positioned homes, the data supports confident pricing — but the premium went to properties buyers competed for, not to aspirational list prices. For buyers, the takeaway is preparation: in the top tier, winning offers still need to be sharp and fast. For trustees and executors, the gap between San Francisco and the national luxury trend is a reminder that luxury value is intensely local.

    Source: Homes.com analysis of August 2026 MLS transactions, via Business Wire. Based on publicly marketed sales; excludes private and off-market transactions, which are common at the highest tier.

    Frequently Asked Questions

    What was San Francisco’s median home price in August 2026?

    CAR reported a detached-home median of $1,875,000. The separate SFAR MLS / RPR series reported a single-family median sold price of $1,700,000. Use each figure with its own source and coverage.

    Which county had the highest median price?

    San Mateo, at $2,250,000 for detached homes, among the five counties compared.

    Where did homes sell fastest?

    San Mateo recorded 11 median days on market, followed by Santa Clara at 12, in the August CAR detached-home figures.

    Which county had the tightest inventory?

    San Francisco recorded 1.3 months of unsold inventory in the CAR county comparison.

    Was San Francisco a buyer’s or seller’s market?

    The August SFAR MLS / RPR supply figures favored sellers, particularly for single-family homes. Conditions for a specific property depend on its price, location and competition.

    Sources and Methodology

    This article adapts Bay Area County Market Comparison — Aug 2026, compiled by Catherine Bassick. County figures are attributed in that report to California Association of REALTORS® County Market Updates, Trends At A Glance, August 2026. San Francisco property-type figures are attributed to SFAR MLS / Realtors Property Resource® Market Activity and Market Trends reports, with data as of August 2026.

    The tables use the report’s exact August snapshot figures. The original graphs are retained: January 2025 through July 2026 points were estimated from C.A.R. county trend charts. Median prices reflect the mix of properties sold and are not a measure of appreciation for an individual home. Countywide statistics do not isolate the luxury segment.

    Source resources: C.A.R. county reports | RPR Market Trends methodology

    Links above identify the data providers and reporting tools; they are not direct links to the original August 2026 source reports.

  • The Real Scares in Your Home This October (And How to Avoid Them)

    By Catherine Bassick, Bassick Advisors at Douglas Elliman — San Francisco and Boston real estate, trusts and estates. Published October 1, 2026.

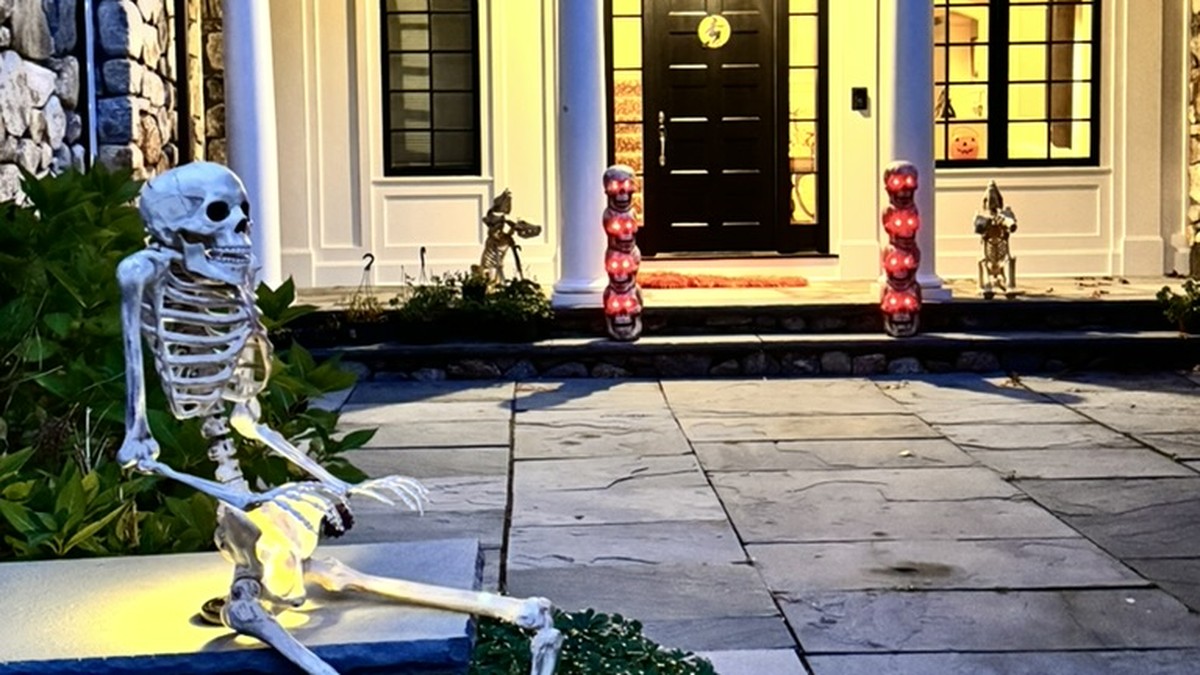
    October is the season for haunted houses, but the scares that actually cost homeowners money aren’t the ones with sheets over them. They’re the burst pipe at 11 PM, the uninsured roof leak, the frozen sprinkler line nobody shut down in time.

    With the weather turning, this is exactly the right time to get ahead of them. And if you’ve just purchased a home, there are a few things I recommend doing before you even move in.

    Six Things to Do Before You Move Into Your New Home

    1. Change the locks on every exterior door

    You have no idea how many copies of those keys exist: former owners, their dog walker, a contractor from three years ago, a neighbor who “forgot to give theirs back.” A house full of strangers’ keys is its own kind of haunted.

    Change the locks on every exterior door, including the garage entry and any side doors, before you move in. It’s a relatively small expense for complete peace of mind.

    2. Change every toilet seat

    I know. Just do it.

    It’s inexpensive, it takes ten minutes per bathroom, and you’ll never wonder, or shudder, about it again. New home, fresh start, all the way down to the details. Where every detail matters.

    3. Deep clean. Hire a professional. It’s worth it

    Even if the sellers left the house spotless, hire a professional to deep clean before you unpack. Pros get the inside of the oven, the tops of the cabinets, the baseboards, the window tracks and every cobweb-prone corner you won’t have time or energy for once the furniture is in.

    Starting with a truly clean house changes how the whole move feels.

    4. Learn where your main water and gas shutoffs are

    This is the one people skip, and it’s the one that can cost them.

    When a pipe bursts at 11 PM, you don’t want to be Googling “where is my water shutoff” with water pooling in the hallway like something out of a bad horror movie.

    Find the shutoffs, make sure everyone in the household knows where they are, and tag them clearly. While you’re at it, locate the electrical panel and make sure the circuits are properly labeled.

    Five minutes of preparation can save an enormous amount of damage later.

    5. Meet your neighbors and get their phone numbers

    Knock on the doors on either side and across the street. Introduce yourself and swap numbers.

    Neighbors are your early-warning system. They’ll tell you about the street’s quirks, warn you about package thieves and keep an eye on things when you travel. Far more useful than any motion-sensor pumpkin.

    In twenty years of selling homes, I’ve never met a homeowner who regretted knowing their neighbors.

    6. Start a house binder and put the emergency numbers in it first

    Before anything else goes in, write down the emergency numbers for your new town and state, along with the non-emergency numbers for police, fire and animal control.

    Then add the people you may need when something goes wrong: your plumber, electrician, HVAC company, roofer, locksmith, alarm company, veterinarian and nearby hospital or urgent care.

    Keep the binder somewhere you can grab it in ten seconds. A kitchen drawer is better than a cloud folder you’d need to unlock your phone to find. During an actual emergency, flipping to a page beats scrambling to look up a number while your heart is pounding.

    Then keep building on it.

    Your house binder should include your homeowners insurance policy and agent contact, utility accounts, school information, HOA documents and rules, warranties for major systems and appliances, closing documents, and a simple record of improvements and repairs with receipts and dates.

    I would also include a page showing exactly where the water, gas and electrical shutoffs are located.

    One binder. One place. Nothing to dig for during a crisis, an insurance claim or, years from now, when it’s time to sell.

    Once you’re moved in, the responsibility changes from preparing your home to protecting it. And that’s where some of the most expensive surprises can hide.

    The Skeletons in Your Closet (and Walls, and Attic)

    Here’s the truth I tell every client: homeowners don’t lose resale value because of paint colors or dated kitchens. The bigger problems are often the skeletons hiding behind the walls and on top of the roof: the unglamorous maintenance nobody wants to think about until something goes wrong.

    When I walk into a listing appointment and find deferred maintenance, I know the inspector is likely to find it too, and I know it may become part of the buyer’s negotiations.

    These are the things I tell homeowners never to cut corners on, especially heading into the colder months:

    Roof and gutters

    Clean the gutters. Clogged gutters can contribute to water intrusion and hidden damage, and they’re exactly the kind of thing that looks perfectly fine from the ground until someone gets up there and takes a closer look.

    HVAC system

    Service it regularly. A well-maintained system can last longer, operate more efficiently and is far less likely to become an unpleasant surprise during a home inspection.

    Change your air filters regularly

    This may be one of the highest-return five minutes in homeownership. A clogged filter restricts airflow, forces the system to work harder and can contribute to higher energy use, unnecessary wear and poor indoor air quality. Put it on your calendar and keep spare filters in the house so there’s never an excuse.

    Plumbing

    Small drips become big problems. If a faucet drips or a toilet runs, fix it now, not “eventually.” Eventually is how a haunted house gets its reputation.

    Fix every leak immediately and have significant leaks professionally inspected

    Water you can see may only be part of the story. A professional can determine whether moisture has reached walls, floors or other areas you can’t see. Water damage and mold can be expensive problems and may later become disclosure issues when you sell.

    Check your lawn sprinklers and schedule the end-of-season shutdown before the first freeze

    In colder climates, water left in sprinkler lines can freeze, expand and damage pipes and sprinkler heads. Put winterization on the calendar every year rather than waiting for the weather forecast to remind you.

    Indoor air quality

    Whether it’s a whole-house system or individual units, clean air matters, and indoor air quality is increasingly something homeowners and buyers pay attention to.

    Water source and filtration

    Know what you’re drinking. If you’re on well water, have it tested as appropriate. If you’re on municipal water and you’re concerned about its taste or quality, investigate the source and consider whether filtration makes sense for your home.

    Home and fire insurance: reviewed, not just purchased

    This is the one that keeps me up at night long after the trick-or-treaters have gone home.

    Too many homeowners buy a policy, put it in a drawer and never look at it again. Review your coverage annually with your insurance professional. Ask whether your replacement-cost assumptions reflect current construction costs and make sure you understand the coverage, exclusions and deductibles that apply to risks relevant to your property, including wildfire, flood and earthquake where appropriate.

    Insurance isn’t just paperwork. It is part of the financial foundation protecting your home.

    Why I’m Telling You This

    My job as your real estate advisor isn’t simply to help you buy or sell a house. It’s to help you protect one of the largest financial assets you may ever own.

    Every item on these lists comes from the same basic principle: small problems are almost always easier and less expensive to address before they become big ones.

    The move-in checklist protects you from day one. Good maintenance habits help protect your property and your equity for as long as you own the home, and they can make an enormous difference when the day eventually comes to sell.

    A well-maintained home generally presents better, inspects cleaner and gives a seller fewer problems to resolve when a buyer begins looking closely.

    This October, make sure the only scares in your house are the ones you put out on the porch.

    The Bassick House Binder

    Would you like a Bassick House Binder for your home?

    Let us know and we’ll be happy to provide one to help you keep your important home information, emergency contacts, insurance details, warranties and maintenance records organized and close at hand.

    Curious what your home is worth in today’s market? Get a confidential home valuation. No obligation, just real numbers.

    Visit BassickAdvisors.com to request your confidential valuation.


    About the author: Catherine Bassick leads Bassick Advisors at Douglas Elliman, serving San Francisco and Boston in residential real estate with a focus on trusts and estates.

    Where every detail matters.

  • Boston Suburbs Housing Market Update — September 2026

    Wellesley, Weston, Newton, Needham, Natick and Dover

    By Catherine Bassick, Bassick Advisors at Douglas Elliman Real Estate. Published September 29, 2026.

    Boston suburbs market

    MARKET UPDATE · SEPTEMBER 2026 · DATA THROUGH SEPTEMBER 25

    Six Boston suburbs, three different stories. Wellesley and Dover are rising, Newton and Weston are flat to lower, and Natick is the tightest market.

    WELLESLEY MEDIAN
    $2,400,000
    ▲ 8.5% vs. 2025
    DOVER MEDIAN
    $2,074,000
    ▲ 8.9% vs. 2025
    NATICK SUPPLY
    1.9 months
    ● Tightest of the six
    WESTON AVERAGE PRICE
    +14.0%
    Median fell 2.2%

    The short version

    • Wellesley (median $2,400,000, up 8.5%) and Dover (up 8.9% to $2,074,000) are rising. Weston, Newton, Needham and Natick are flat to slightly lower.
    • Sales are down in five of the six towns, which points to a shortage of sellers more than a shortage of buyers.
    • Natick (1.9 months) and Wellesley (2.2) are the tightest markets. Dover (6.3) is balanced.
    • In Weston the average price rose 14.0% while the median fell 2.2%. A few $4 million-plus sales are lifting the average.
    • Since 2020, every one of the six towns has posted a median gain of 44% or more.

    Market at a glance

    Wellesley and Dover are pushing prices up while Weston, Newton and Needham have slipped slightly, and Natick is the tightest market of the group.

    Through September 25, the Wellesley median is $2,400,000, up 8.5% from last year, and Dover is up 8.9% to $2,074,000. Weston, Newton, Needham and Natick medians are flat to slightly lower. Sales counts are down in five of the six towns, which points to a shortage of sellers more than a shortage of buyers.

    Since 2020, every one of the six towns has posted a median gain of 44% or more: Weston +61.8%, Natick +59.4%, Dover +54.2%, Wellesley +46.8%, Needham +44.7% and Newton +44.3%.

    Six towns compared

    Boston suburbs market comparison

    Boston suburbs market comparison

    Boston suburbs market comparison

    Boston suburbs market comparison

    TOWN (YEAR TO DATE, SEPT. 25) SALES CHANGE VS. 2025 MEDIAN PRICE CHANGE VS. 2025 AVG. DAYS ON MARKET MONTHS OF SUPPLY
    Weston 80 -5.9% $2,588,000 -2.2% 67 3.6
    Wellesley 192 -8.6% $2,400,000 +8.5% 32 2.2
    Dover 48 +6.7% $2,074,000 +8.9% 62 6.3
    Newton 366 -4.7% $1,880,000 -4.6% 36 3.1
    Needham 194 -3.0% $1,773,000 -1.8% 34 3.0
    Natick 216 -2.3% $1,095,000 -0.5% 34 1.9

    A common rule of thumb is that under 5 to 6 months of supply favors sellers, about 6 months is balanced, and 7 or more favors buyers. By that yardstick, five of the six towns lean toward sellers, with Natick, Wellesley, Needham and Newton under 3.2 months, and Dover sits at the balanced line.

    Town by town

    Wellesley is the strongest performer. The median is $2.4 million, up 46.8% from $1,635,000 in 2020, and homes are selling in 32 days on average. Sales at $3 million and above rose from 45 to 62, and those at $4 million and above from 18 to 30, so the move up is being driven by the top end. With 2.2 months of supply, it favors sellers.

    Search homes in Wellesley

    Weston shows how averages can mislead. The average price jumped 14.0% to $3,388,000, yet the median slipped 2.2%. Sales at $4 million and above rose from 14 to 18, which pulls the average up while typical homes are not appreciating. Homes are taking longer to sell (67 days versus 52 last year), but supply has improved from 5.8 months to 3.6 as inventory fell from 49 listings to 37.

    Search homes in Weston

    Dover is up 8.9% in median price on a small sample of 48 sales, but it is also the softest market on supply. At 6.3 months, it sits at the balanced-market line, with 32 active listings versus 28 a year ago and 62 average days on market.

    Search homes in Dover (link coming soon)

    Newton and Needham are steady rather than strong. Newton’s median is down 4.6% to $1,880,000, though price per square foot is up 1.3% to $628. Needham’s listings rose 24% from 50 to 62, lifting supply from 2.7 to 3.0 months.

    Search homes in Newton | Search homes in Needham

    Natick is the value-priced, high-demand pocket. The median is essentially flat at $1,095,000, and at 1.9 months it has the least supply of the six.

    Search homes in Natick

    WHAT IT MEANS

    A town’s headline median is only part of the picture. The upper end of Wellesley is pulling that market ahead, while Weston and Dover buyers have more room to negotiate. In the towns with median declines of a few percent, price per square foot is still rising modestly, which suggests a shift in what is selling rather than a drop in value.

    What this means for you

    The numbers reward precision: price to recent closings, compare at the town and price-tier level, and read medians rather than averages.

    For buyers

    • Dover (6.3 months of supply) and Weston (67 average days on market) offer the most negotiating room.
    • Natick (1.9 months) and Wellesley (2.2 months) are the most competitive, so be ready to move on well-priced homes.
    • Needham’s inventory is up 24% year over year, which gives buyers more choice than last year.

    For sellers

    • Where the market is flat, the sale often turns on condition and positioning. Newton, Needham and Natick medians are down or flat, so plan around closed comparables rather than last year’s headline number.
    • Wellesley’s top end has the strongest tailwind: sales at $4 million and above are up 67%.
    • In Weston and Dover, longer days on market mean pricing discipline matters most.

    For trustees, executors and family fiduciaries

    • Use medians and price per square foot when documenting value. In Weston, the average rose 14.0% while the median fell 2.2%, so an average can overstate what a typical property is worth.
    • Timing a disposition depends on the town. Supply is tightest in Natick and Wellesley and softest in Dover and Weston, which affects how long a property is likely to take to sell and how aggressively to price it.
    • Small samples (Dover had 48 sales, Weston 80) can swing sharply from a few transactions, so treat their year-over-year percentages with caution.

    Thinking about your own property?

    Catherine Bassick, Bassick Advisors at Douglas Elliman Real Estate. 617.800.7764 | catherine@bassickadvisors.com

    Source: MLS. Figures are year-to-date through September 25, 2026 for Wellesley, Weston, Newton, Needham, Natick and Dover. Percentage changes are calculated from the reported figures. Data is taken from sources deemed reliable but is subject to errors and omissions.

    Related Boston market report

    Comparing suburban homes with city condos? Read our September 2026 Boston condo market update for Back Bay, Beacon Hill, South End and Seaport.

  • Boston Condo Market Update — September 2026

    Back Bay, Beacon Hill, South End, Seaport and more

    By Catherine Bassick, Bassick Advisors at Douglas Elliman Real Estate. Published September 29, 2026.

    Boston condo market

    BOSTON CONDO MARKET · SEPTEMBER 2026 · DATA THROUGH SEPTEMBER 27

    Boston condo dollar volume is up 10.5% on flat sales. Here is where the money is moving, neighborhood by neighborhood, and what it means for buyers, sellers and fiduciaries. This report covers condominiums only.

    MEDIAN PRICE
    $1,060,000
    ▲ 10.4% vs. 2025
    AVERAGE PRICE
    $1,538,558
    ▲ 10.5% vs. 2025
    CLOSED SALES
    1,825
    ● Flat vs. 2025
    DOLLAR VOLUME
    $2.81B
    ▲ 10.5% vs. 2025

    The short version

    • The median condo price is $1,060,000, up 10.4%, on exactly the same 1,825 closings as last year.
    • The downtown core is leading: Mid/Downtown closings are up 42%, the Seaport 23%, Beacon Hill 22%. The South End is down 14% and South Boston 10%.
    • 53.5% of closings are $1 million or more, the first time that share has topped half. Sales under $1 million fell from 960 to 849.
    • 99 closings at $2,000+ per square foot, up from 75. One Dalton averages $2,921 per square foot.
    • Supply is about 3.1 months, so sellers who price to recent closings still hold the advantage.

    Market at a glance

    Boston condo dollar volume is up 10.5% on flat sales, so the market is trading up rather than trading more.

    Through September 27, 1,825 Boston condos have closed, exactly matching this point last year. The average price is $1,538,558 and the median is $1,060,000, up 10.5% and 10.4% from 2025. Both are the highest of any year in the 2019 to 2026 reports, and the median has now crossed $1 million.

    The gains are concentrated in the downtown core and the upper price tiers. Back Bay, Beacon Hill, Mid/Downtown and the Seaport are all up in closings, while the South End, South Boston and the North End are down.

    Boston condos by the numbers

    The deal count is flat but the dollars are not: the same 1,825 closings produced about $267 million more in sales than a year ago.

    Boston condo market figures

    The longer view puts the year in context. Sales are about 36% below the 2021 pace of 2,833, yet the median is up 24.7% from $850,000 and the average is up 27.7% from $1,204,955. Dollar volume is 17.7% below 2021, which shows how much of the market has shifted to higher price points rather than more transactions.

    WHAT IT MEANS

    Prices are holding and rising even though transaction counts have not recovered. That combination usually signals limited supply. Buyers are paying more for fewer available homes, and sellers who price accurately are being rewarded. The report shows five-year appreciation of 4.9% for the median and 5.5% for the average, against 3.4% over ten years, so recent growth has outpaced the long-run rate.

    Where the money is going: Boston condo neighborhoods

    Activity is moving toward the downtown core and away from the outer neighborhoods: Mid/Downtown closings are up 42%, while the South End and South Boston are down 14% and 10%.

    Boston neighborhood market comparison

    Boston neighborhood sales figures

    Back Bay remains the dollar leader at $670.2 million, about 26% of all condo volume. Mid/Downtown dollar volume rose 45% to $377.3 million, which is consistent with the wave of new-tower closings at Winthrop Center and the other downtown buildings covered below.

    The price tiers tell the same story. Sales at $1 million and above are 53.5% of all closings, the first time that share has topped half in these reports, up from 47.4% last year. Closings at $1 million or more rose from 865 to 976, and $3 million to $9.99 million sales jumped from 117 to 161. Meanwhile, closings under $1 million fell from 960 to 849, and sub-$500,000 sales dropped by a third, from 153 to 103.

    Boston condo price tiers

    WHAT IT MEANS

    The entry level of the Boston condo market is thinning while the upper tiers are widening. A buyer shopping under $1 million is competing for a shrinking pool of closed deals, and a seller above $1 million is finding a deeper buyer base than a year ago.

    Search Boston homes by neighborhood

    Each button opens a live search of current listings in that neighborhood.

    Back Bay | Beacon Hill | South End | South Boston | Seaport | Charlestown | Mid/Downtown | North End | Waterfront

    Luxury and new development

    Boston luxury residences

    High-end Boston condo sales are rebuilding: 99 closings this year are at $2,000 per square foot or more, up from 75 in 2025 but still short of the 145 recorded at this point in 2023.

    Across all Boston condos, closings at $1,000 per square foot or higher rose from 942 to 1,081, and those under $1,000 per square foot fell from 883 to 744. In the selected full-service buildings tracked in the report, 194 of 232 resales (84%) closed at $1,000 per square foot or more, 166 (72%) at $1 million or more, and 90 (39%) at $2 million or more.

    The top of the resale market is led by a handful of buildings.

    Boston luxury building sales comparison

    The year’s largest reported resale is a two-unit combination at Heritage (1005/1006) that closed August 28 for $21.5 million, about $4,323 per square foot. Two One Dalton units closed at $14 million each, and a 50 Liberty Wharf penthouse sold for $14.5 million.

    New towers are adding to the total. Sales at buildings that are not yet sold out are shown below.

    NEW DEVELOPMENT (2026 CLOSINGS) CLOSINGS AVG. PRICE PER SQ. FT. DOLLAR VOLUME SHARE SOLD
    The Ritz-Carlton Residences South Station 39 $2,252 $110.4M 24%
    Winthrop Center 27 $2,076 $86.9M 46%
    Raffles Boston 7 $3,269 $30.5M 86%
    St. Regis 8 $1,769 $23.6M 62%
    The Parker 11 $1,131 $10.0M 75%

    This week’s report added seven new closings, totaling about $15.0 million, at Heritage, Millennium Tower (two), Pierce Boston, One Dalton, FP3 and Winthrop Center.

    WHAT IT MEANS

    The luxury tier is not one market. Buildings such as One Dalton, Heritage and Raffles are commanding $2,500 to $3,300 per square foot, while Harbor Towers and Millennium Place sit near $900 to $1,035. Buyers and sellers should look at building-level comps, not a citywide average, because the spread between buildings is far larger than the change in the overall market.

    Inventory and supply

    Supply remains tight by the report’s own yardstick: Boston condos carry about 3.1 months of inventory on an MLS basis, well under the 5 to 6 months the report cites as the seller’s-market threshold.

    That 3.1 months is the first-quarter 2026 reading, compared with 3.3 months a year earlier. On the full-service side, 151 resales are on the market across the tracked luxury buildings, with an average asking price of $3,586,460 and a median of $2,395,000. The average ask is $2,105 per square foot, and 128 listings are priced above $1,500 per square foot, 60 of them above $2,000. Echelon (28 listings) and Millennium Tower (17) have the most units for sale.

    Asking prices are what sellers hope for, and closings are what buyers pay. At One Dalton, the ten resales currently listed ask between $2,653 and $5,081 per square foot, against a year-to-date closed average of $2,921. Sellers priced at or below recent closings are the ones matching real buyer demand.

    One caution on comparing eras: the report notes that full-service inventory is now pulled from the MLS because downtown brokers increasingly use it, while earlier counts from the 2009 peak, year-end 2009 and year-end 2010 came from the LINK database. Treat comparisons to those years as directional, not exact.

    WHAT IT MEANS

    Low supply is what has kept prices firm while sales counts stay flat. If more listings arrive this fall, especially in the $1,500-plus per square foot tier where asks are concentrated, the balance could shift. For now, the data still favors sellers who price to recent closings.

    What this means for you

    The numbers reward precision: price to recent closings, compare at the building level, and read medians rather than averages.

    For buyers

    • Boston condos under $1 million are the tightest segment: closings below that line fell from 960 to 849 this year, so expect competition for well-priced units.
    • In luxury buildings, the gap between asking and closed price per square foot is your negotiating guide. Ask for the building’s year-to-date closings before making an offer.
    • Neighborhoods with falling closings, such as the South End and South Boston, may offer more choice than the downtown core, where activity is rising.

    For sellers

    • With Boston supply near 3 months, correctly priced homes are being absorbed. Pricing above the recent closed range is the main way to lose time.
    • Top-tier sellers have the best year-over-year tailwind: Boston sales between $3 million and $10 million are up 38%.
    • Building matters more than neighborhood at the high end. Use closings from your own building, not a citywide figure.

    For trustees, executors and family fiduciaries

    • Use medians, price per square foot and same-building closings when documenting value. New-development closings can push averages up, and the spread between buildings runs from about $900 to about $2,900 per square foot.
    • Valuation dates matter. Boston’s average condo price moved 10.5% in a single year, so a valuation tied to an earlier date can differ meaningfully from today’s market.
    • Several buildings have only a handful of closings this year, so a single sale can move a building’s average. Look at individual comparable sales before relying on a building average.

    Thinking about your own property?

    Catherine Bassick, Bassick Advisors at Douglas Elliman Real Estate. 617.800.7764 | catherine@bassickadvisors.com

    Source: MLS. Boston condominium figures are closed sales reported through September 27, 2026, covering Back Bay, Bay Village, Beacon Hill, Chinatown, Charlestown/Navy Yard, Fenway, the Financial, Theatre and Leather Districts, Downtown and Midtown, North End, Seaport, South Boston, South End, West End and the Waterfront. Percentage changes are calculated from the reported figures. Data is taken from sources deemed reliable but is subject to errors and omissions.

    Related Boston market report

    Considering a home outside the city? Compare prices, sales and supply in our September 2026 housing market update for Wellesley, Weston, Newton, Needham, Natick and Dover.

Bassick Advisors

San Francisco | Boston

WHEN EVERY DETAIL COUNTS.

Bassick Real Estate Advisors is a collective of luxury real estate professionals committed to providing in-depth market expertise, unparalleled connectivity, and sophisticated negotiation strategies in the acquisition and sale of global real estate.